
Mathematics, 17.12.2020 14:00 jeffersonpaul283
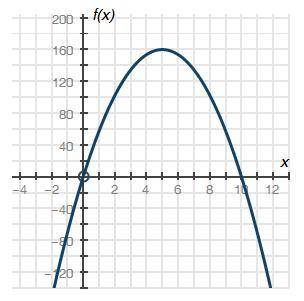
The graph below shows a company's profit f(x), in dollars, depending on the price of pencils x, in dollars, sold by the company:
Graph of quadratic function f of x having x intercepts at ordered pairs negative 0, 0 and 10, 0. The vertex is at 5, 160.
Part A: What do the x-intercepts and maximum value of the graph represent? What are the intervals where the function is increasing and decreasing, and what do they represent about the sale and profit? (4 points)
Part B: What is an approximate average rate of change of the graph from x = 2 to x = 5, and what does this rate represent? (3 points)
Part C: Describe the constraints of the domain. (3 points)

Answers: 2


Other questions on the subject: Mathematics
Mathematics, 22.06.2019 00:20, ridzrana02
Jubal wrote the four equations below. he examined them, without solving them, to determine which equation has no solution. which of jubal’s equations has no solution hurry
Answers: 1
You know the right answer?
The graph below shows a company's profit f(x), in dollars, depending on the price of pencils x, in d...
Questions in other subjects:


Mathematics, 04.03.2020 04:19

Mathematics, 04.03.2020 04:19

Mathematics, 04.03.2020 04:19


