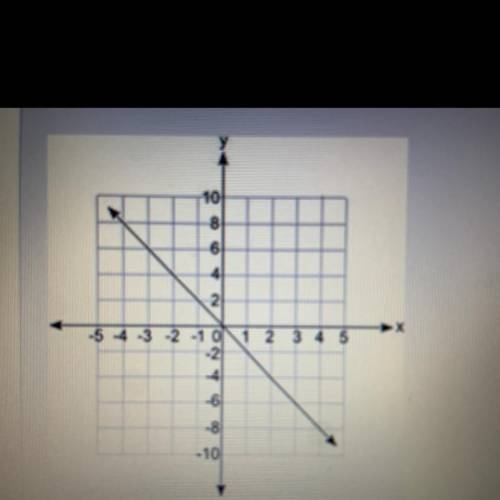
Which equation does the graph represent (see picture)
A. y = -2x
B. y= -1/2x
C. y = 2x<...

Mathematics, 17.12.2020 09:10 ajaydonlee
Which equation does the graph represent (see picture)
A. y = -2x
B. y= -1/2x
C. y = 2x
D. y = 1/2 x

Answers: 3


Other questions on the subject: Mathematics
Mathematics, 22.06.2019 00:30, winterblanco
Answer 20 points and brainiest ! on the board, your teacher writes an example of how to find the median. one of the numbers is erased, leaving what is shown, 18, 30, 26,12 22. what is the median? a. 10 b. 20 c. 24 d. 28
Answers: 1
Mathematics, 22.06.2019 00:40, sonyarucker
Can you divide 25 into 4 equal groups? explain why or why not.
Answers: 1
Mathematics, 22.06.2019 03:00, Dweath50
For a house call, a veterinarian charges $70, plus $40 an hour. a. write an equation that represents the total fee y y (in dollars) the veterinarian charges for a visit lasting x x hours. equation: y= y= no response given b. find the x-intercept. x-intercept:
Answers: 2
You know the right answer?
Questions in other subjects:

English, 16.01.2020 01:31

Biology, 16.01.2020 01:31

Mathematics, 16.01.2020 01:31

History, 16.01.2020 01:31


