
Mathematics, 16.12.2020 23:30 kellysurgit
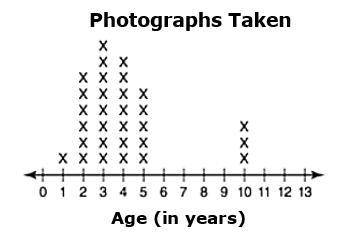
The line plot shows the ages of the children who had their photographs taken at a photography studio during a certain week.
Which statement is true about the graph of the children who had their photographs taken?
A. The graph has an outlier at 1.
B. The data in the graph is symmetrical in shape.
C. The graph has a peak at 10.
D. The graph has a cluster of data.

Answers: 3


Other questions on the subject: Mathematics
Mathematics, 21.06.2019 14:00, Pankhud5574
1. preform the indicated operation. then estimate to see whether the proposed result is reasonable. 811.1 - 8.039 803.071 803.061 803.161 831.061 2. the ordered pair (1, 2) lies in which quadrant? quadrant ii quadrant iv quadrant iii quadrant i 3. sean tries to drink 3 liters of water every day how my millimeters of water does he drink in a day? 0.3 ml 0.003 ml 3,000 ml 30 ml 4. find the least common multiple. (lcm). 10, 36 5 180 20 360
Answers: 3
Mathematics, 21.06.2019 20:00, myparentsrock17
Given ab and cb are tangents of p, and m =10°. what is the measure of abp?
Answers: 1
You know the right answer?
The line plot shows the ages of the children who had their photographs taken at a photography studio...
Questions in other subjects:

Mathematics, 06.11.2020 19:40

History, 06.11.2020 19:40
Mathematics, 06.11.2020 19:40


Social Studies, 06.11.2020 19:40
Mathematics, 06.11.2020 19:40

English, 06.11.2020 19:40


