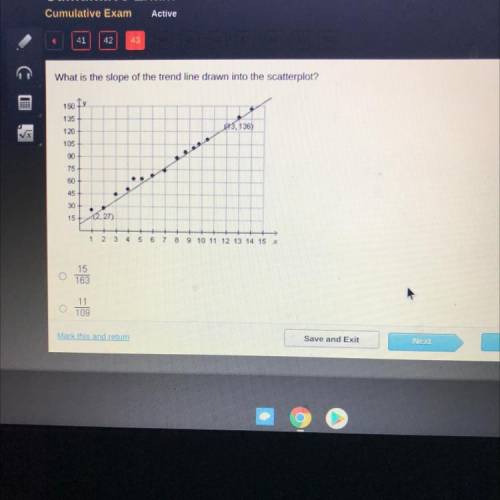
What is the slope of the trend line drawn into the scatterplot?
150 18
613.136)
135
120
105
75
8 8 8 8
45
15
12.27)
++
1 2 3 4 5 6 7 8 9 10 11 12 13 14 15 X
Use the frequency distribution, which shows the number of american voters (in millions) according to age, to find the probability that a voter chosen at random is in the 18 to 20 years old age range. ages frequency 18 to 20 5.9 21 to 24 7.7 25 to 34 20.4 35 to 44 25.1 45 to 64 54.4 65 and over 27.7 the probability that a voter chosen at random is in the 18 to 20 years old age range is nothing. (round to three decimal places as needed.)
Ian is in training for a national hot dog eating contest on the 4th of july. on his first day of training, he eats 4 hot dogs. each day, he plans to eat 110% of the number of hot dogs he ate the previous day. write an explicit formula that could be used to find the number of hot dogs ian will eat on any particular day.