
Mathematics, 16.12.2020 19:20 jkirby29
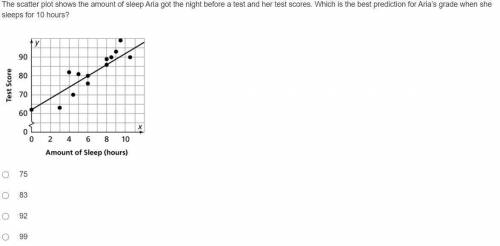
The scatterplot shows the amount of sleep that Aria got the night before a test and her test scores. What type of relationship do you see between amount of sleep and test scores
A. In general, Aria scores lower on a test when she sleeps more and scores higher on a test when she sleeps less.
B. In general, Aria scores higher on a test no matter how much she sleeps.
C. In general, Aria scores lower on a test no matter how much she sleeps.
D. In general, Aria scores higher on a test when she sleeps more and scores lower on a test when she sleeps less.
(dont look at the answers on the attachment just look at the scatter plot)

Answers: 3


Other questions on the subject: Mathematics
Mathematics, 21.06.2019 14:00, anggar20
Ms. sutton recorded the word counts and scores of the top ten essays in a timed writing contest. the table shows her data. how does the word count of an essay relate to its score in the contest? word count tends to decrease as the score decreases. word count tends to increase as the score decreases. word count tends to remain constant as the score decreases. word count has no apparent relationship to the score of the essay.
Answers: 1
Mathematics, 21.06.2019 21:30, fheight01
Name and describe the three most important measures of central tendency. choose the correct answer below. a. the mean, sample size, and mode are the most important measures of central tendency. the mean of a data set is the sum of the observations divided by the middle value in its ordered list. the sample size of a data set is the number of observations. the mode of a data set is its highest value in its ordered list. b. the sample size, median, and mode are the most important measures of central tendency. the sample size of a data set is the difference between the highest value and lowest value in its ordered list. the median of a data set is its most frequently occurring value. the mode of a data set is sum of the observations divided by the number of observations. c. the mean, median, and mode are the most important measures of central tendency. the mean of a data set is the product of the observations divided by the number of observations. the median of a data set is the lowest value in its ordered list. the mode of a data set is its least frequently occurring value. d. the mean, median, and mode are the most important measures of central tendency. the mean of a data set is its arithmetic average. the median of a data set is the middle value in its ordered list. the mode of a data set is its most frequently occurring value.
Answers: 3
You know the right answer?
The scatterplot shows the amount of sleep that Aria got the night before a test and her test scores....
Questions in other subjects:

Mathematics, 05.05.2021 19:30
Mathematics, 05.05.2021 19:30

History, 05.05.2021 19:30


Mathematics, 05.05.2021 19:30


