Mathematics, 16.12.2020 02:30 abigailguzman4108
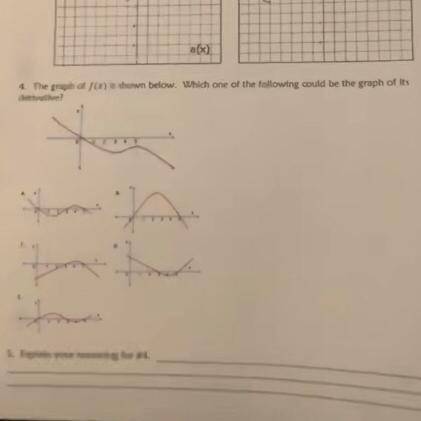
The graph at f(x) is shown below. Which one the following could be the graph of its diversity?


Answers: 3


Other questions on the subject: Mathematics

Mathematics, 21.06.2019 15:40, dmurdock1973
What is the probability of rolling a single die greater than 4
Answers: 1

Mathematics, 21.06.2019 17:30, tommyaberman
(least common multiples) the answer that i had in the 1st step was lcm of airline tickets sold=72. idk if that even matters but just in case. ! three co-workers are busy selling airline tickets over the phone. in an 8-hour day, charles can sell 8 airline tickets, ann can sell 9 airline tickets, and michelle can sell 6 airline tickets. step 2 of 2: what is the smallest number of 8-hour days needed for each of them to achieve the same number of sales? it takes charles . it takes . it takes .
Answers: 1

Mathematics, 21.06.2019 17:30, euraleecewilliams
1mile equals approximately 1.6 kilometers. which best approximates the number of miles in 6 kilometers?
Answers: 1

Mathematics, 21.06.2019 18:30, chandranewlon
Agraphic designer created a logo on eight and a half by 11 inch paper. in order to be placed on a business card, the logo needs to be one and 7/10 inches by 2 and 1/5 in. what is the scale factor of the dilation
Answers: 1
You know the right answer?
The graph at f(x) is shown below. Which one the following could be the graph of its diversity?
Questions in other subjects:


Mathematics, 30.09.2019 19:00

Health, 30.09.2019 19:00


Mathematics, 30.09.2019 19:00

Mathematics, 30.09.2019 19:00


