
Mathematics, 16.12.2020 01:00 markleal9484
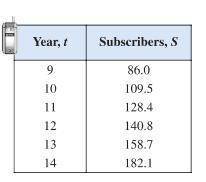
The table shows the numbers of cellular phone subscribers S (in millions) in the United states from 1999 through 2004, where t represents the year, with t = 9 corresponding to 1999. Use the regression feature of a graphing utility to find a linear model for the data. Use the model to find the year in which the number of subscribers exceeded 200 million.

Answers: 1


Other questions on the subject: Mathematics
Mathematics, 21.06.2019 19:30, johndiaz26
Solve the following inequalities and show the solution on a number line. 2x+3< 3(4x+5)
Answers: 1
Mathematics, 21.06.2019 20:50, brea2006
An automobile assembly line operation has a scheduled mean completion time, μ, of 12 minutes. the standard deviation of completion times is 1.6 minutes. it is claimed that, under new management, the mean completion time has decreased. to test this claim, a random sample of 33 completion times under new management was taken. the sample had a mean of 11.2 minutes. assume that the population is normally distributed. can we support, at the 0.05 level of significance, the claim that the mean completion time has decreased under new management? assume that the standard deviation of completion times has not changed.
Answers: 3
Mathematics, 22.06.2019 00:30, bossefamily1
Use the irregular polygon below. show all work. a. find the perimeter. b. find the area. the angles of the irregular polygon is 2, 8, 8, and 4.
Answers: 2
You know the right answer?
The table shows the numbers of cellular phone subscribers S (in millions) in the United states from...
Questions in other subjects:

Chemistry, 01.12.2020 20:50

Mathematics, 01.12.2020 20:50

Health, 01.12.2020 20:50

Physics, 01.12.2020 20:50


