
Mathematics, 15.12.2020 22:50 camk4420
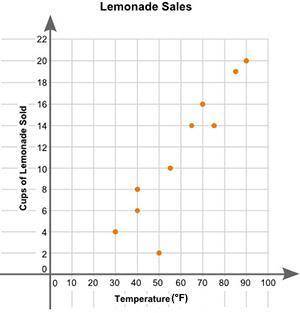
Eric plotted the graph below to show the relationship between the temperature of his city and the number of cups of lemonade he sold daily. (see the graph)
Answer the following questions:
Part A: Describe the relationship between the temperature of the city and the number of cups of lemonade sold.
Part B: Describe how you can make the line of best fit. Write the approximate slope and y-intercept of the line of best fit. Show your work, including the points that you use to calculate the slope and y-intercept. (3 points)

Answers: 3


Other questions on the subject: Mathematics
Mathematics, 21.06.2019 17:00, 2021CanadyRaniya
The parabola x= √y-9 opens: a.)up b.)down c.)right d.)left
Answers: 1
Mathematics, 21.06.2019 18:00, cexe2630
The administrator of a large assisted living facility wanted to know the average age of the residents living at the facility. he randomly selected 12 residents and determined their age, listed here: 80, 65, 75, 83, 68, 73, 88, 79, 94, 72, 79, 68 what's the average age of the sample of residents? a. 79 years old b. 68 years old c. 75 years old d. 77 years old
Answers: 1
Mathematics, 21.06.2019 19:00, Keekee9847
What is the equation of the line in point-slope form? y+ 4 = 1/2(x+4) y-4 = 1/2(x + 4) y-0 = 2(x - 4) y-4 = 2(8-0)
Answers: 2
You know the right answer?
Eric plotted the graph below to show the relationship between the temperature of his city and the nu...
Questions in other subjects:
Mathematics, 07.01.2021 22:50


Mathematics, 07.01.2021 22:50
Mathematics, 07.01.2021 22:50


Spanish, 07.01.2021 22:50
Mathematics, 07.01.2021 22:50


