
Mathematics, 15.12.2020 21:10 yasiroarafat12
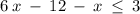
Which graph below represents the solution to the inequality 6 x − 12 − x ≤ 3

Answers: 3
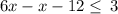
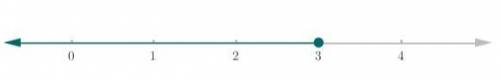
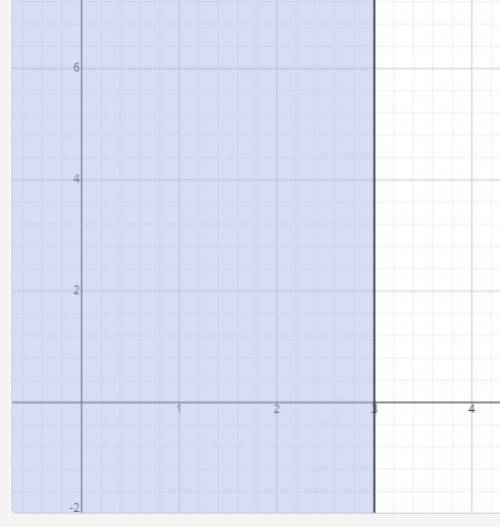
![6x-12-x\le \:3\quad :\quad \begin{bmatrix}\mathrm{Solution:}\:&\:x\le \:3\:\\ \:\mathrm{Interval\:Notation:}&\:(-\infty \:,\:3]\end{bmatrix}](/tpl/images/0986/9113/0b26f.png)


Other questions on the subject: Mathematics
Mathematics, 21.06.2019 14:10, mbatton879
5500 dollars is placed in an account with an annual interest rate of 6.5%. to the nearest tenth of a year, how long will it take for the account value to reach 19700 dollars?
Answers: 2
Mathematics, 21.06.2019 20:00, whosdarrin9396
If cos(2x) = tan^2(y), show that cos(2y) = tan^2(x).
Answers: 3
Mathematics, 21.06.2019 23:00, ptrlvn01
1. an economy consists of three workers: larry, moe, and curly. each works 10 hours a day and can produce two services: mowing lawns and washing cars. in an hour, larry can either mow one lawn or wash one car; moe can either mow one lawn or wash two cars; and curly can either mow two lawns or wash one car. a. calculate how much of each service is produced under the following circumstances: a. all three spend all their time mowing lawns. b. all three spend all their time washing cars. c. all three spend half their time on each activity d. larry spends half of his time on each activity, while moe only washes cars and curly only mows lawns b. using your answers to part a, draw a production possibilities frontier and label points a, b, c, and d on your graph. explain why the production possibilities frontier has the shape it does. c. are any of the allocations calculated in part a inefficient? explain.
Answers: 3
You know the right answer?
Which graph below represents the solution to the inequality 6 x − 12 − x ≤ 3...
Questions in other subjects:
Mathematics, 12.11.2020 23:10


Biology, 12.11.2020 23:10


History, 12.11.2020 23:10
Health, 12.11.2020 23:10


