
Mathematics, 15.12.2020 18:30 shahedalahmad2017
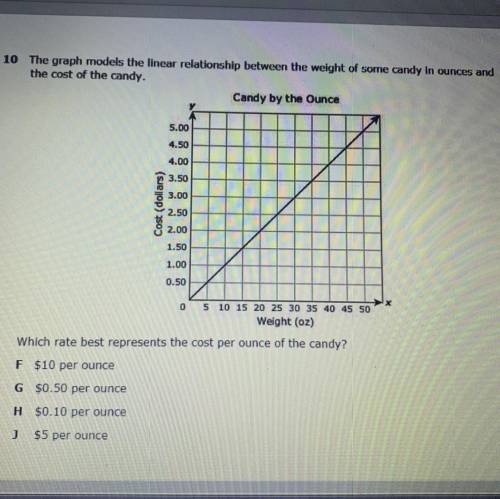
10 The graph models the linear relationship between the weight of some candy in ounces and
the cost of the candy.
Candy by the Ounce
5.00
4.50
4.00
3.50
3.00
Cost (dollars)
2.50
2.00
1.50
1.00
0.50
0 5 10 15 20 25 30 35 40 45 50
Weight (oz)
Which rate best represents the cost per ounce of the candy?
F $10 per ounce
G $0.50 per ounce
H $0.10 per ounce
J $5 per ounce

Answers: 3


Other questions on the subject: Mathematics
Mathematics, 22.06.2019 00:00, victorialeona81
Find the root(s) of f (x) = (x- 6)2(x + 2)2.
Answers: 1
Mathematics, 22.06.2019 00:30, winterblanco
Answer 20 points and brainiest ! on the board, your teacher writes an example of how to find the median. one of the numbers is erased, leaving what is shown, 18, 30, 26,12 22. what is the median? a. 10 b. 20 c. 24 d. 28
Answers: 1
Mathematics, 22.06.2019 02:00, emilyblaxton
Gables properties corp. is leasing office building with an area of 49b^2+70b+25. what is the shape of the building? a) rectangle b) square
Answers: 3
You know the right answer?
10 The graph models the linear relationship between the weight of some candy in ounces and
the cost...
Questions in other subjects:
Mathematics, 02.09.2021 06:10
Mathematics, 02.09.2021 06:10
Mathematics, 02.09.2021 06:10
Mathematics, 02.09.2021 06:10

Social Studies, 02.09.2021 06:10
Mathematics, 02.09.2021 06:10

English, 02.09.2021 06:10

Biology, 02.09.2021 06:10
Biology, 02.09.2021 06:10


