
Mathematics, 15.12.2020 01:10 jakobcook7pdvy6d
Select the correct answer.
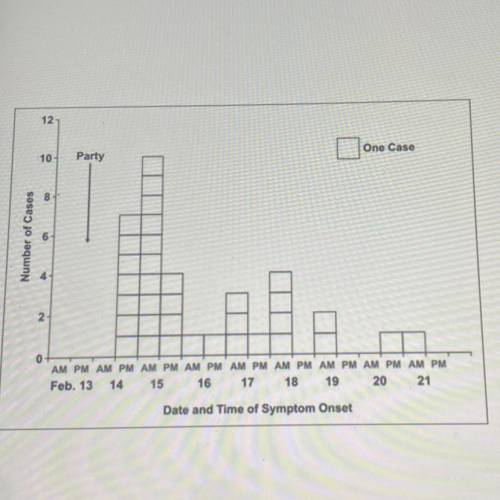
The graph shows the number of cases of people developing salmonella symptoms at different
times of a fixed number of days,
According to the graph, when were people most likely to develop salmonella symptoms?
A. February 14, p. m,
B. February 15, p. m
C. February 15, a. m.
D. February 18, a. m.
E. February 18, p. m

Answers: 1


Other questions on the subject: Mathematics
Mathematics, 21.06.2019 18:40, addiemaygulley2835
Aportion of a hiking trail slopes downward at about an 84° angle. to the nearest tenth of a flot, what is the value of x, the distance the hiker traveled along the path, if he has traveled a horizontal distance of 120 feet? a. 143.3 b. 12.5 c. 120.7 d. 130.2
Answers: 1
Mathematics, 21.06.2019 19:30, makaylahunt
Aregular pentagon with a perimeter of 21 inches is dilated by a scale factor of 5/3 to create a new pentagon. what is the perimeter of the new pentagon?
Answers: 2
You know the right answer?
Select the correct answer.
The graph shows the number of cases of people developing salmonella symp...
Questions in other subjects:


Mathematics, 23.07.2021 03:10


