
Mathematics, 14.12.2020 19:20 dirgoperadiego2122
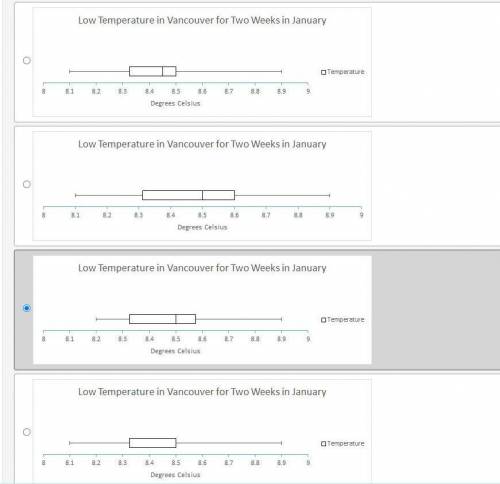
The following data shows the low temperature in Vancouver, in degrees Celsius, for two weeks in January one year.
8.90, 8.35, 8.50, 8.65, 8.55, 8.20, 8.50, 8.32, 8.50, 8.60, 8.60, 8.30, 8.10, 8.65
Which box plot best represents this data?

Answers: 2


Other questions on the subject: Mathematics
Mathematics, 21.06.2019 20:30, amyaacrawford86
Solve each quadratic equation by factoring and using the zero product property. 14x - 49 = x^2
Answers: 2
Mathematics, 21.06.2019 20:50, hinsri
The first side of a triangle measures 5 in less than the second side, the third side is 3 in more than the first side, and the perimeter is 17 in. how long is the third side? if s represents the length of the second side, which of the following represents the length of the third side? s-5 ws-2 s+ 3 next question ask for turn it in
Answers: 1
You know the right answer?
The following data shows the low temperature in Vancouver, in degrees Celsius, for two weeks in Janu...
Questions in other subjects:

History, 19.02.2020 17:52

Mathematics, 19.02.2020 17:53
Mathematics, 19.02.2020 17:53


Social Studies, 19.02.2020 17:53


