
Mathematics, 14.12.2020 18:10 benjaminatkinson1
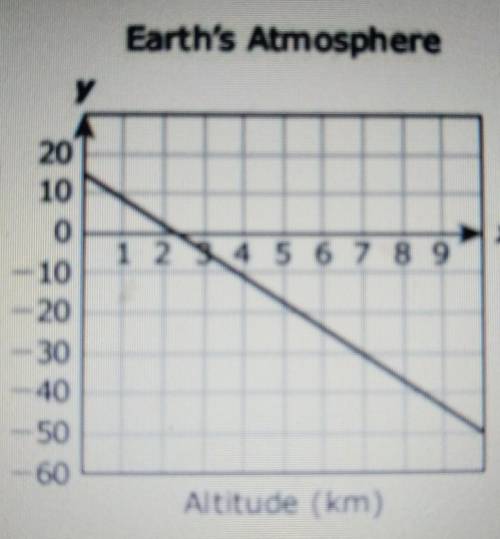
The graph models the linear relationship between the temperature of Earth's atmosphere and the altitude above sea level. Earth's Atmosphere Which of these best represents the rate of change of the temperature with respect to altitude? -6.5°C/km -3.5°C/km -0.29°C/km -0.15°C/km

Answers: 1


Other questions on the subject: Mathematics
Mathematics, 21.06.2019 14:40, leannesmith90101
Sara sells beaded necklaces she makes a profit of 4 dollars pn every neclace she sells which table represents the profit sara makes
Answers: 1
Mathematics, 21.06.2019 18:10, mayamcmillan11
An initial investment of $100 is now valued at $150. the annual interest rate is 5%, compounded continuously. the equation 100e0.05t = 150 represents the situation, where t is the number of years the money has been invested. about how long has the money been invested? use your calculator and round to the nearest whole number. years
Answers: 3
Mathematics, 21.06.2019 22:30, blackordermember
Which description is represented by a discrete graph? kiley bought a platter for $19 and several matching bowls that were $8 each. what is the total cost before tax? the temperature at 9 a. m. was 83° f and is heating up at an average rate of 6°f per hour. what is the temperature x hours later? juan ate an egg with 78 calories and some cereal with 110 calories per serving for breakfast. what is the total amount of calories he consumed? a bottle contained 2,000 ml of liquid and is being poured out at an average rate of 300 ml per second. how much liquid is left in the bottle after x seconds?
Answers: 3
You know the right answer?
The graph models the linear relationship between the temperature of Earth's atmosphere and the altit...
Questions in other subjects:

Mathematics, 26.05.2020 03:00

Computers and Technology, 26.05.2020 03:00


English, 26.05.2020 03:00


