
Mathematics, 14.12.2020 08:50 moneybaggtjuan
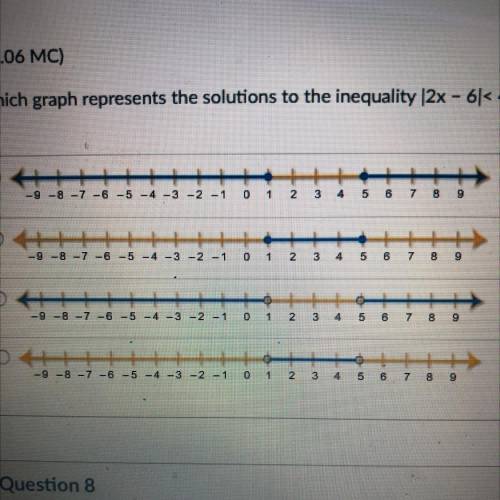
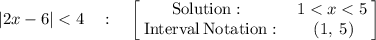
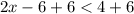
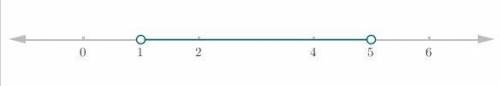
Which graph represents the solutions to the inequality |2x - 6 < 4? (5 points)
-9-8-7 -6 -5 -4 -3 -2 -1 0 1 2 3 4 5 6 7 8 9
-9-8-7 -6 -5 -4 -3 -2 -1 0 1 2 3 4 5 6 7 8
9
-9 -8 -7 -6 -5 -4 -3 -2 -1 0 1 2 3 4 5 6 7 8 9
-9-8-7 -6 -5 -4 -3 -2 -1
0 1 2 3 4 5 6 7 8 9

Answers: 2


Other questions on the subject: Mathematics
You know the right answer?
Which graph represents the solutions to the inequality |2x - 6 < 4? (5 points)
-9-8-7 -6 -5 -4 -...
Questions in other subjects:
Mathematics, 13.07.2021 17:50


Mathematics, 13.07.2021 17:50

History, 13.07.2021 17:50

English, 13.07.2021 17:50


