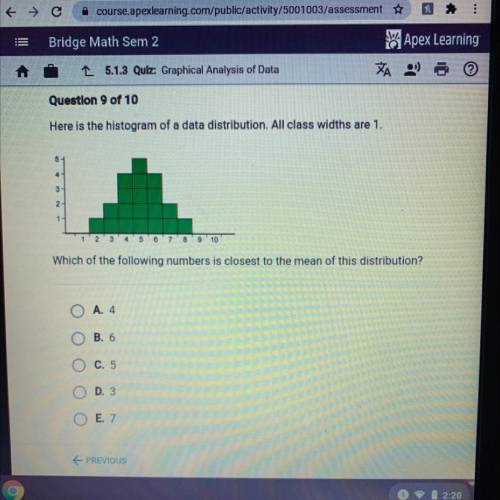
Here is the histogram of a data distribution. All class widths are 1.
5
4
3
2
1
1
2
3
4
5 6 7 8 9 10
Which of the following numbers is closest to the mean of this distribution?
0
A. 4
B. 6
C. 5
D. 3
E. 7
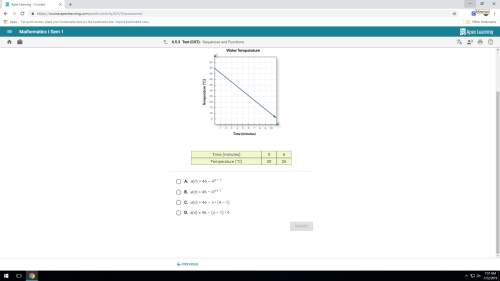
An architect is designing a water fountain for a park she uses the given function to model the water jet flowing from the fountain nozzles where h(x) gives the height of the water jugs in feet x feet from the starting point h(x)=-1/20x+x+15
The annual snowfall in a town has a mean of 38 inches and a standard deviation of 10 inches. last year there were 63 inches of snow. find the number of standard deviations from the mean that is, rounded to two decimal places. 0.44 standard deviations below the mean 2.50 standard deviations below the mean 0.44 standard deviations above the mean 2.50 standard deviations above the mean