
Mathematics, 13.12.2020 07:40 emilyrobles
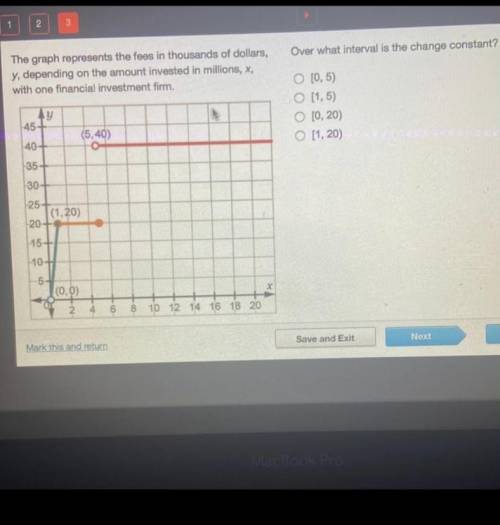
The graph represents the fees in thousands of dollars,
y, depending on the amount invested in millions, x,
with one financial investment firm.
Over what interval is the change constant?
[0,5)
(1,5)
[0, 20)
[1, 20)

Answers: 1


Other questions on the subject: Mathematics
Mathematics, 21.06.2019 17:30, christinaaaat
Janet drove 300 miles in 4.5 hours. write an equation to find the rate at which she was traveling
Answers: 2
Mathematics, 22.06.2019 00:30, EBeast7390
Asalsa recipe uses green pepper, onion, and tomato in the extended ratio 3: 5: 7. how many cups of tomato are needed to make 105 cups of salsa? a. 7 b. 21 c. 35 d. 49
Answers: 3
You know the right answer?
The graph represents the fees in thousands of dollars,
y, depending on the amount invested in milli...
Questions in other subjects:

History, 20.10.2019 19:00

History, 20.10.2019 19:00
Mathematics, 20.10.2019 19:00


Geography, 20.10.2019 19:00

English, 20.10.2019 19:00


