HEY YOU!! PLEASE I NEED HELPPP
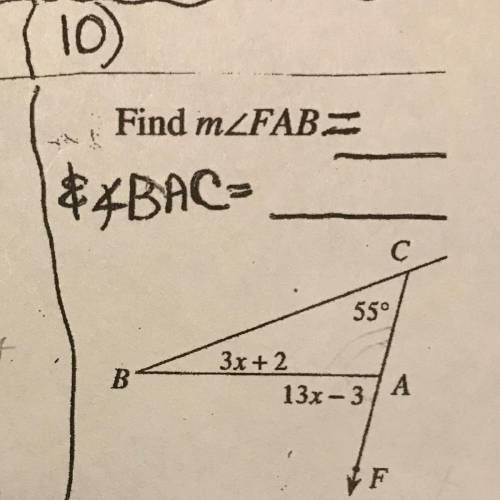
find angle BAC and angle FAB
...

Mathematics, 12.12.2020 17:00 rubencharomarti
HEY YOU!! PLEASE I NEED HELPPP
find angle BAC and angle FAB

Answers: 1


Other questions on the subject: Mathematics
Mathematics, 21.06.2019 18:00, afolmar2006
Write an equation for the function that includes the points (1,4/5) and (2,2/3)
Answers: 1
Mathematics, 21.06.2019 20:30, attp203
Martha has a deck of cards. she has lost some of the cards, and now the deck only contains nine spades, eleven diamonds, eight clubs, and twelve hearts. martha predicts that whenever she draws a card from the deck without looking, she will draw a club one-fifth of the time. which activity would best allow martha to test her prediction? a. randomly draw a card from the box and see if it is a club. b. randomly draw a card. then, continue to draw another card until all eight clubs are drawn. c. randomly draw and replace a card 120 times. then, observe how close to 30 times a club is drawn. d. randomly draw and replace a card 100 times. then, observe how close to 20 times a club is drawn.
Answers: 3
Mathematics, 21.06.2019 20:50, brea2006
An automobile assembly line operation has a scheduled mean completion time, μ, of 12 minutes. the standard deviation of completion times is 1.6 minutes. it is claimed that, under new management, the mean completion time has decreased. to test this claim, a random sample of 33 completion times under new management was taken. the sample had a mean of 11.2 minutes. assume that the population is normally distributed. can we support, at the 0.05 level of significance, the claim that the mean completion time has decreased under new management? assume that the standard deviation of completion times has not changed.
Answers: 3
Mathematics, 22.06.2019 00:30, trujillo03
1.3.25 question suppose 40​% of all voters voted for a particular candidate. to simulate exit polls regarding whether or not voters voted for this​ candidate, five random samples of size 1010 and five random samples of size 10001000 have been generated using technology using a population proportion of 0.400.40​, with the accompanying results. complete parts a through c below. click the icon to view the simulation results. a. observe how the sample proportions of successes vary around 0.400.40. simulation compared to sample prop simulation compared to sample prop 1 ▾ 6 ▾ greater than 0.40 less than 0.40 equal to 0.40 2 ▾ less than 0.40 greater than 0.40 equal to 0.40 7 ▾ greater than 0.40 less than 0.40 equal to 0.40 3 ▾ greater than 0.40 less than 0.40 equal to 0.40 8 ▾ equal to 0.40 greater than 0.40 less than 0.40 4 ▾ greater than 0.40 equal to 0.40 less than 0.40 9 ▾ less than 0.40 greater than 0.40 equal to 0.40 5 ▾ equal to 0.40 less than 0.40 greater than 0.40 10 ▾ equal to 0.40 greater than 0.40 less than 0.40 click to select your answer(s) and then click check answer. 2 parts remaining clear all check answer
Answers: 3
You know the right answer?
Questions in other subjects:


Spanish, 27.09.2019 21:10

Computers and Technology, 27.09.2019 21:10


