
Mathematics, 11.12.2020 01:30 alyo31500
I need help plz!! Part C
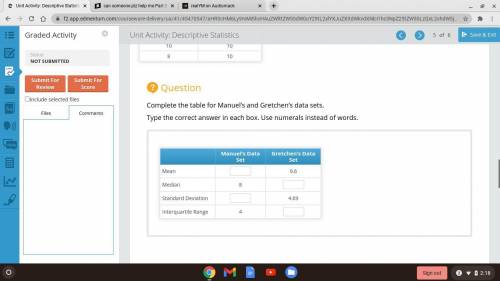
Determine the mean, median, standard deviation, and interquartile range for each data set. Then, use the graphing tool to determine the value of the standard deviation.
Number of Days Member Used Facility Last Month
Manuel’s Data Gretchen’s Data
3 22
6 4
8 7
11 8
12 12
8 15
6 10
3 7
10 9
5 6
14 13
9 3
7 8
10 10
8 10

Answers: 3


Other questions on the subject: Mathematics
Mathematics, 21.06.2019 13:20, yoyo80431
Suppose that x and y are both differentiable functions of t and are related by the given equation. use implicit differentiation with respect to t to determine startfraction dy over dt endfraction in terms of x, y, and startfraction dx over dt endfraction .
Answers: 3
Mathematics, 21.06.2019 14:00, Pauline3607
Use the knowledge of x- and y- intercepts to choose the correct graph of the equation 3x+6y=6
Answers: 1
Mathematics, 21.06.2019 18:30, kevin72937
Three times the sum of a number and seven is negative thirty-six. what is the number?
Answers: 2
Mathematics, 21.06.2019 20:00, haleysmith8608
Given the graphed function below which of the following orders pairs are found on the inverse function
Answers: 1
You know the right answer?
I need help plz!! Part C
Determine the mean, median, standard deviation, and interquartile range fo...
Questions in other subjects:


Mathematics, 03.06.2021 18:30
Mathematics, 03.06.2021 18:30

Biology, 03.06.2021 18:30
Mathematics, 03.06.2021 18:30


