
Mathematics, 11.12.2020 01:00 maderaada
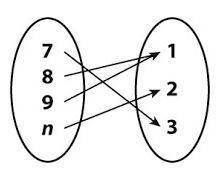
The mapping diagram shows a function. What could be a possible value for the missing number n?
A. 7
B. 9
C. 8
D. 15

Answers: 1


Other questions on the subject: Mathematics
Mathematics, 21.06.2019 16:00, isabellemaine
Martin likes to make flower bouquets that have 3 daffodils and 4 tulips per vase. a daffodil has a mass of d grams, a tulip has a mass of t grams, and the vase has a mass of u grams. the expression 5(3d + 4t + v) describes the mass of 5 bouquets. match each amount in the situation with the expression that represents it. situation expression number of bouquets mass of one bouquet mass of the tulips in one bouquet 4t mass of the daffodils in one bouquet 3d + 4t + v
Answers: 2
Mathematics, 21.06.2019 16:00, kell22wolf
Part one: measurements 1. measure your own height and arm span (from finger-tip to finger-tip) in inches. you will likely need some from a parent, guardian, or sibling to get accurate measurements. record your measurements on the "data record" document. use the "data record" to you complete part two of this project. name relationship to student x height in inches y arm span in inches archie dad 72 72 ginelle mom 65 66 sarah sister 64 65 meleah sister 66 3/4 67 rachel sister 53 1/2 53 emily auntie 66 1/2 66 hannah myself 66 1/2 69 part two: representation of data with plots 1. using graphing software of your choice, create a scatter plot of your data. predict the line of best fit, and sketch it on your graph. part three: the line of best fit include your scatter plot and the answers to the following questions in your word processing document 1. 1. which variable did you plot on the x-axis, and which variable did you plot on the y-axis? explain why you assigned the variables in that way. 2. write the equation of the line of best fit using the slope-intercept formula $y = mx + b$. show all your work, including the points used to determine the slope and how the equation was determined. 3. what does the slope of the line represent within the context of your graph? what does the y-intercept represent? 5. use the line of best fit to you to describe the data correlation.
Answers: 2
Mathematics, 21.06.2019 21:00, Abdullah1860
George is putting trim around his rectangular deck, including the gate. he will need 44 feet of trim to do the entire deck. if the deck is 13 feet long, how wide is the deck?
Answers: 2
You know the right answer?
The mapping diagram shows a function. What could be a possible value for the missing number n?
A. 7...
Questions in other subjects:


