
Mathematics, 10.12.2020 22:40 spookymod4845
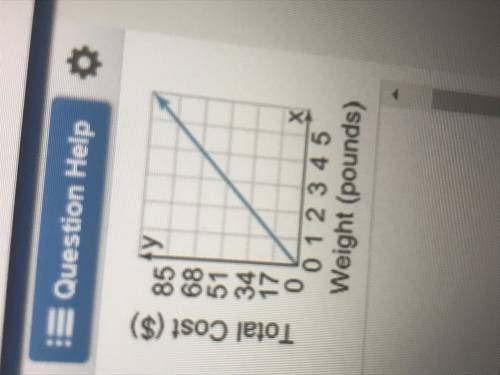
The graph shows the relationship between the weight of silver and the total cost. Which of the following is true?
A. The graph shows a proportional relationship.
B. The point (2,34) means that 34 pounds of silver cost $2.00 per pound.
C. The point (1,17) shows the constant of proportionality.
D. The point (0,0) means that 0 pounds of silver cost $0.00.
E. The point (4,68) means that $4.00 is the cost for 68 pounds of silver.

Answers: 3


Other questions on the subject: Mathematics
Mathematics, 21.06.2019 18:00, aleilyg2005
List the sides of δrst in in ascending order (shortest to longest) if: m∠r =x+28°, m∠s = 2x+16°, and m∠t = x+12°
Answers: 1
Mathematics, 21.06.2019 21:00, morganpl415
Eliza wants to make $10,000 from her investments. she finds an investment account that earns 4.5% interest. she decides to deposit $2,500 into an account. how much money will be in her account after 14 years?
Answers: 1
You know the right answer?
The graph shows the relationship between the weight of silver and the total cost. Which of the follo...
Questions in other subjects:

Physics, 12.08.2020 14:01
Mathematics, 12.08.2020 14:01

History, 12.08.2020 14:01


Biology, 12.08.2020 14:01


