
Mathematics, 10.12.2020 19:40 Kzamor
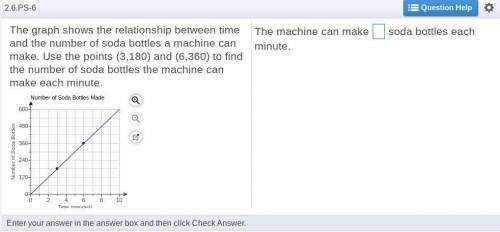
The graph shows the relationship between time and the number of soda bottles a machine can make. Use the points (3,180) and (6,360) to find the number of soda bottles the machine can make each minute.

Answers: 1


Other questions on the subject: Mathematics
Mathematics, 21.06.2019 20:30, cgarnett5408
Find the magnitude, correct to two decimal places, made by each of the following with positive direction of the x axis a) y= x the answer is 45° but i don’t know how
Answers: 2
Mathematics, 21.06.2019 22:00, jacksonshalika
Billie holiday sells children's clothing for sara vaughn's toddler shop. baby blankets sell for $29.99 after a markup rate based on cost of 109%. find the cost and the markup.
Answers: 2
You know the right answer?
The graph shows the relationship between time and the number of soda bottles a machine can make. Use...
Questions in other subjects:

English, 12.12.2019 03:31

History, 12.12.2019 03:31

Business, 12.12.2019 03:31
Mathematics, 12.12.2019 03:31


