
Mathematics, 10.12.2020 19:10 nessross1018
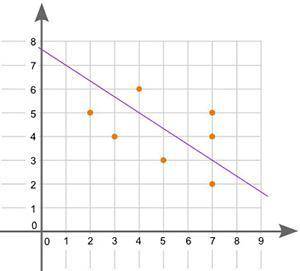
A scatter plot and a possible line of best fit is shown:
Is the line of best fit accurate for the data shown?
No, because the line does not touch any points
No, because the line should touch every point
Yes, because it touches the y-axis
Yes, because it passes through the center of the data points

Answers: 3


Other questions on the subject: Mathematics
Mathematics, 21.06.2019 12:30, mary2971
The total number of photos on hannah’s camera is a linear function of how long she was in rome. she already had 44 photos on her camera when she arrived. then she took 24 photos each day for 6 days. what is the rate of change of the linear function that represents this
Answers: 1
Mathematics, 22.06.2019 00:00, jhenifelix
Cd is the perpendicular bisector of both xy and st, and cy=20. find xy.
Answers: 1
You know the right answer?
A scatter plot and a possible line of best fit is shown:
Is the line of best fit accurate for the d...
Questions in other subjects:

Biology, 30.07.2021 19:10


Chemistry, 30.07.2021 19:10

Mathematics, 30.07.2021 19:10
English, 30.07.2021 19:10


