
Mathematics, 10.12.2020 18:50 kelyanthecrafte
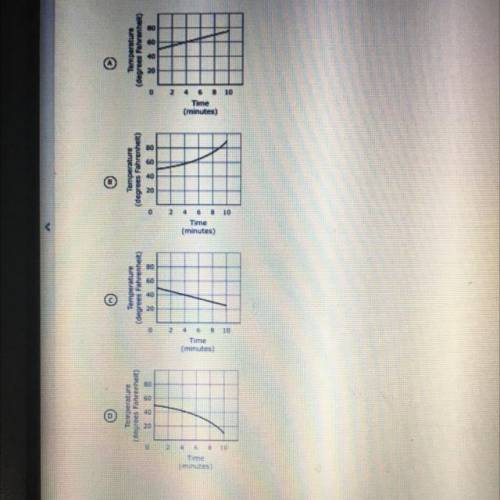
QUESTION: During a ten minute science experiment the temperature of a substance decreases at a constant rate . WHICH GRAPH REPRESENTS THIS SITUATION?
A
B
C
D
???the graphs are on the picture please help me

Answers: 1


Other questions on the subject: Mathematics
Mathematics, 21.06.2019 18:30, allsherm23
Hii1977 cleaner shrimp are a species of shrimp that clean parasites from other organisms. fish allow the shrimp to eat the parasites in their mouth. the shrimp get a source of nutrition. the relationship between the shrimp and the fish is this association indicates that for the smaill aneser arecommensal, mutualistic, or parasitic for the begger one the anser are the shrimp and fish benefit each other , the shrimp harm the fish, or the fish do not benetit from the shrimp
Answers: 3
Mathematics, 21.06.2019 20:50, kidpryo1
There are three bags: a (contains 2 white and 4 red balls), b (8 white, 4 red) and c (1 white 3 red). you select one ball at random from each bag, observe that exactly two are white, but forget which ball came from which bag. what is the probability that you selected a white ball from bag a?
Answers: 1
Mathematics, 21.06.2019 22:00, stricklandashley43
1. how do you convert the repeating, nonterminating decimal 0. to a fraction? explain the process as you solve the problem.
Answers: 2
You know the right answer?
QUESTION: During a ten minute science experiment the temperature of a substance decreases at a const...
Questions in other subjects:

Computers and Technology, 08.11.2019 17:31

Mathematics, 08.11.2019 17:31
Mathematics, 08.11.2019 17:31

English, 08.11.2019 17:31


