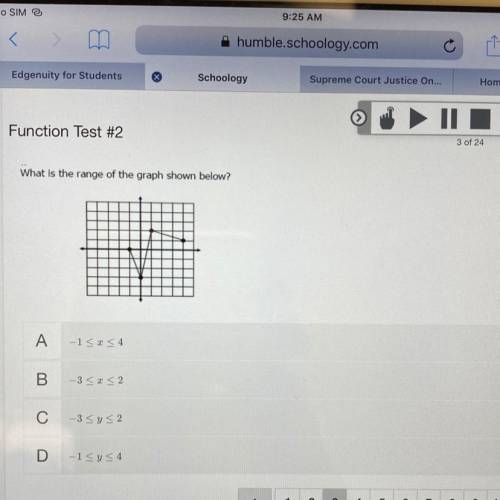
What is the range of the graph shown below?
A
-1<<4
B
-3 << 2
С...

Mathematics, 10.12.2020 18:50 nenaa29
What is the range of the graph shown below?
A
-1<<4
B
-3 << 2
С
-3
D
-1

Answers: 3


Other questions on the subject: Mathematics
Mathematics, 21.06.2019 17:10, Halessoftball
Jessica and martha each have a bag of cookies with unequal quantities. they have 30 cookies total between the two of them. each of them ate 6 cookies from their bag. the product of the number of cookies left in each bag is not more than 80. how many more cookies will jessica have martha? if x represents the number of cookies jessica started with, complete the statements below. the inequality that describes the relationship between the number of cookies each one of them has is x^2 - x +224 > = 0.jessica has at least cookies more than martha.
Answers: 3
Mathematics, 21.06.2019 19:00, tanaemichel
John used linear combination to solve the system of equations shown. he did so by multiplying the first equation by -3 and the second equation by another number to eliminate the x-terms. what number did jonas multiply the second equation by? 4x-6y=23x+5y=11
Answers: 2
Mathematics, 21.06.2019 21:30, kalieghcook
If t17 = 3 (t5) in an arithmetic progression, find t1 in terms of d.
Answers: 1
Mathematics, 21.06.2019 21:30, mazolethrin6876
The expression 1.01*1.005(^t) gives the amount of money, in thousands of dollars, in carter's savings account (t) years after he opens it. what does 1.01 represent in this expression?
Answers: 1
You know the right answer?
Questions in other subjects:


