
Mathematics, 10.12.2020 18:40 sarahidan
PLEASE HELP IM LITERALLY GOING TO CRY
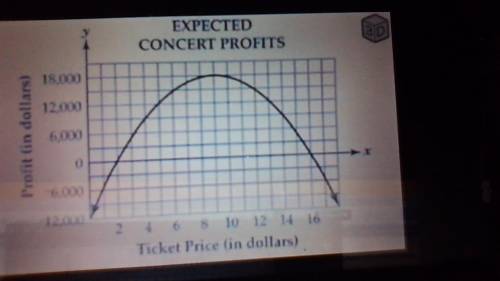
The graph models the relationship between the ticket price for a concert and the expected profits.
Which of the following statements BEST describes the zero(s) of this function?
A.
9 is the zero and indicates when profit is at the maximum
B.
-12,000 is the zero and indicates the cost to put on the concert
C.
2 and 16 are the zeros and indicate the ticket price for which the profit is 0
D.
2 and 16 are the zeros and indicate the number of tickets sold for which the profit is 0

Answers: 3


Other questions on the subject: Mathematics
Mathematics, 21.06.2019 23:30, ameliaduxha7
What is the explicit rule for the sequence in simplified form? −1,−4,−7,−10,−13… an=4−5n an=−4−3n an=2−3n an=−6−5n
Answers: 1
Mathematics, 21.06.2019 23:40, madisonromney2819
Which of the following is best modeled using a linear equation y=ax+b, where a is less than 0?
Answers: 2
Mathematics, 22.06.2019 00:00, AnonymousLizard52303
The probability that a tutor will see 0, 1, 2, 3, or 4 students is given below determine the probability distribution's missing value.
Answers: 1
You know the right answer?
PLEASE HELP IM LITERALLY GOING TO CRY
The graph models the relationship between the ticket price fo...
Questions in other subjects:

Mathematics, 11.07.2019 16:00
Chemistry, 11.07.2019 16:00

Geography, 11.07.2019 16:00


Mathematics, 11.07.2019 16:00
Mathematics, 11.07.2019 16:00


