
Mathematics, 10.12.2020 05:20 ayoismeisjjjjuan
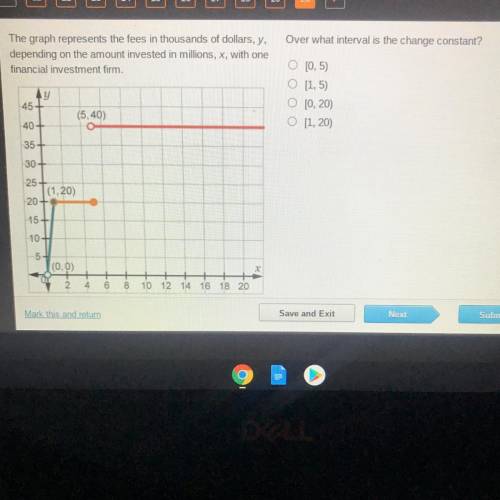
The graph represents the fees in thousands of dollars, y, depending well the amount invested in millions ,x, with one financial investment firm
over what interval is the change constant
o [0,5)
o[1,5)
o[0,20)
o[1,20)

Answers: 2


Other questions on the subject: Mathematics
Mathematics, 21.06.2019 17:20, organicmemez
Researchers were interested in whether relaxation training decreases the number of headaches a person experiences. they randomly assigned 20 participants to a control group or a relaxation training group and noted the change in number of headaches each group reported from the week before training to the week after training. which statistical analysis should be performed to answer the researchers' question?
Answers: 2
Mathematics, 21.06.2019 22:00, amandajennings01
22. catie is starting a babysitting business. she spent $26 to make signs to advertise. she charges an initial fee of $5 and then $3 for each hour of service. write and solve an inequality to find the number of hours she will have to babysit to make a profit. interpret the solution.!
Answers: 1
Mathematics, 21.06.2019 23:30, xandraeden32
Consider the first four terms of the sequence below. what is the 8th term of this sequence?
Answers: 1
You know the right answer?
The graph represents the fees in thousands of dollars, y, depending well the amount invested in mill...
Questions in other subjects:
Mathematics, 03.12.2021 07:30
Mathematics, 03.12.2021 07:30


Social Studies, 03.12.2021 07:30
Mathematics, 03.12.2021 07:30
Mathematics, 03.12.2021 07:30


