
Mathematics, 10.12.2020 01:10 raam360
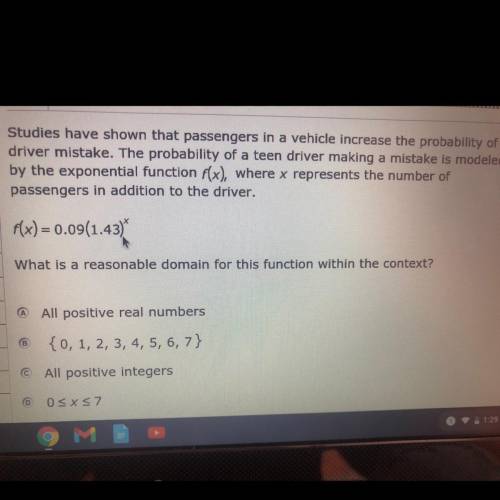
Studies have shown that passengers in a vehicle increase the probability of a
driver mistake. The probability of a teen driver making a mistake is modeled
by the exponential function f(x), where x represents the number of
passengers in addition to the driver.
f(x) = 0.09(1.43)
What is a reasonable domain for this function within

Answers: 1


Other questions on the subject: Mathematics
Mathematics, 21.06.2019 14:30, jorgefrom584
Cass decided to sell game programs for the hockey game. the printing cost was over 20 cents per program with a selling price of 50 cents each. cass sold all but 50 of the programs, and made a profit of $65. how many programs were printed? letting p represent the number of programs printed, set up an equation that describes this situation. then solve your equation for p.
Answers: 1
Mathematics, 21.06.2019 19:30, Tcareyoliver
If 2(a^2+b^2)=(a+b)^2 then, > a+b=0, > ab=0, > a=b, > 2a=b
Answers: 1
Mathematics, 22.06.2019 02:30, misk980
Atrain traveled for 1.5 hours to the first station, stopped for 30 minutes, then traveled for 4 hours to the final station where it stopped for 1 hour. the total distance traveled is a function of time. which graph most accurately represents this scenario? a graph is shown with the x-axis labeled time (in hours) and the y-axis labeled total distance (in miles). the line begins at the origin and moves upward for 1.5 hours. the line then continues upward at a slow rate until 2 hours. from 2 to 6 hours, the line continues quickly upward. from 6 to 7 hours, it moves downward until it touches the x-axis a graph is shown with the axis labeled time (in hours) and the y axis labeled total distance (in miles). a line is shown beginning at the origin. the line moves upward until 1.5 hours, then is a horizontal line until 2 hours. the line moves quickly upward again until 6 hours, and then is horizontal until 7 hours a graph is shown with the axis labeled time (in hours) and the y-axis labeled total distance (in miles). the line begins at the y-axis where y equals 125. it is horizontal until 1.5 hours, then moves downward until 2 hours where it touches the x-axis. the line moves upward until 6 hours and then moves downward until 7 hours where it touches the x-axis a graph is shown with the axis labeled time (in hours) and the y-axis labeled total distance (in miles). the line begins at y equals 125 and is horizontal for 1.5 hours. the line moves downward until 2 hours, then back up until 5.5 hours. the line is horizontal from 5.5 to 7 hours
Answers: 1
You know the right answer?
Studies have shown that passengers in a vehicle increase the probability of a
driver mistake. The p...
Questions in other subjects:


