Mathematics, 10.12.2020 01:00 Mrdwarf7163
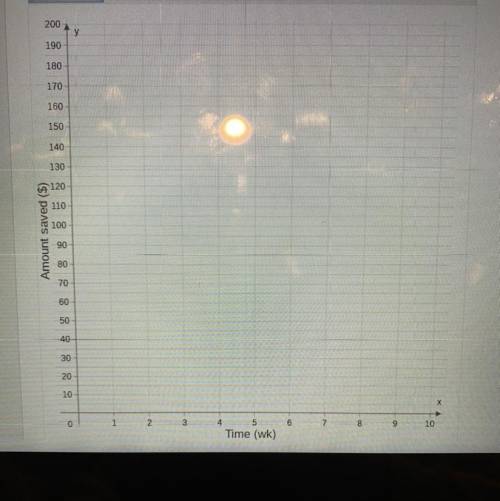
Caleb needs S120 to pay for tickets to an amusement park. He has S75 already and saves $5 a week.
Use the Segment tool to plot a graph representing the amount of money Caleb has saved from the time he begins saving until he has
saved enough for the tickets.
Pls help do the graph!!


Answers: 1


Other questions on the subject: Mathematics


Mathematics, 22.06.2019 02:00, coolkitty35
Arectangular courtyard is 12 feet long and 8 feet wide. a tile is 2 feet long and 2 feet wide. how many tiles are needed to cover the courtyard?
Answers: 1
You know the right answer?
Caleb needs S120 to pay for tickets to an amusement park. He has S75 already and saves $5 a week.
U...
Questions in other subjects:


Mathematics, 09.03.2020 16:21


Arts, 09.03.2020 16:21

Mathematics, 09.03.2020 16:22


Social Studies, 09.03.2020 16:22

History, 09.03.2020 16:23

 =
=


