
Mathematics, 09.12.2020 18:50 vanvalenpeyt
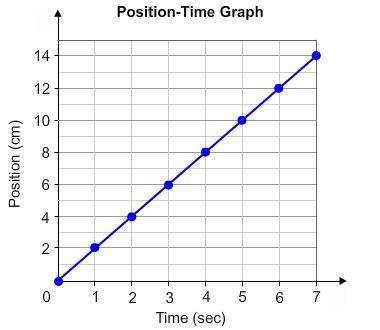
The position data for line 1 was recorded in 1-second intervals. Draw a graph with distance on the y-axis and elapsed time on the x-axis. Reference all distance and time measurements to dot 1. To plot a point, use the circle tool. To draw a line between points, use the line tool. To move a point or line, use the select tool.

Answers: 2


Other questions on the subject: Mathematics
Mathematics, 21.06.2019 16:00, sierravick123owr441
Brent needs to paint a logo made using two right triangles. the dimensions of the logo are shown below. what is the difference between the area of the large triangle and the area of the small triangle? (1 point) select one: a. 4.5 cm2 b. 8.5 cm2 c. 16.5 cm2 d. 33.0 cm2
Answers: 1
Mathematics, 21.06.2019 21:40, avahrider1
The graph of f(x) = |x| is transformed to g(x) = |x + 11| - 7. on which interval is the function decreasing?
Answers: 3
You know the right answer?
The position data for line 1 was recorded in 1-second intervals. Draw a graph with distance on the y...
Questions in other subjects:
Mathematics, 11.02.2021 19:30

Mathematics, 11.02.2021 19:30
Mathematics, 11.02.2021 19:30
Mathematics, 11.02.2021 19:30


