A graph is shown below:
3
2
Which of the following inequalities is best represented by...

Mathematics, 09.12.2020 09:00 jadeafrias
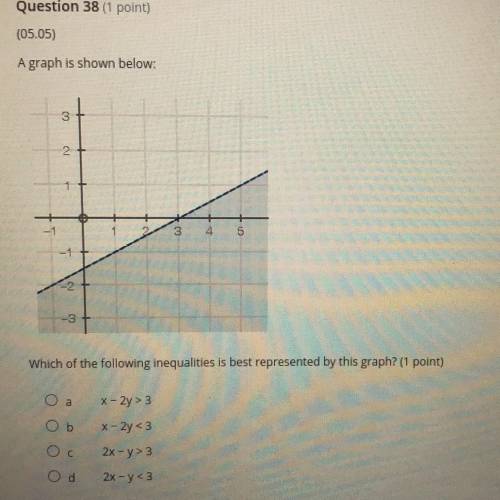
A graph is shown below:
3
2
Which of the following inequalities is best represented by this graph? (1 point)
О а
x - 2y > 3
Ob
x - 2y <3
2x - y>3
Od
2x - y<3

Answers: 3


Other questions on the subject: Mathematics
Mathematics, 21.06.2019 13:50, pedroramirezr2
Samantha swam upstream for some distance in one hour. she then swam downstream the same river for the same distance in only 12 minutes. if the river flows at 4 mph, how fast can samantha swim in still water?
Answers: 1
Mathematics, 21.06.2019 18:30, alleahbethea199
Divide. write in the simplest form. 4 1/6 divided by 10
Answers: 2
Mathematics, 21.06.2019 19:00, aylinkayla
In the figure below, ∠dec ≅ ∠dce, ∠b ≅ ∠f, and segment df is congruent to segment bd. point c is the point of intersection between segment ag and segment bd, while point e is the point of intersection between segment ag and segment df. the figure shows a polygon comprised of three triangles, abc, dec, and gfe. prove δabc ≅ δgfe.
Answers: 1
You know the right answer?
Questions in other subjects:

Mathematics, 05.04.2022 14:00
Mathematics, 05.04.2022 14:00


English, 05.04.2022 14:00

Physics, 05.04.2022 14:00
English, 05.04.2022 14:00
Physics, 05.04.2022 14:00
SAT, 05.04.2022 14:00


