
Mathematics, 09.12.2020 06:50 mariaaalopezz
Let's compare two ant colonies: Ant Colony A and
Ant Colony B. We will use a function, a table, and a
graph to compare these two ant colonies.
Ant Colony A: The function a(x) = 210(1.12) represents
the number of ants in Ant Colony A, x days after an
experiment starts. There is also a table provided for Ant
Colony A on the whiteboard.
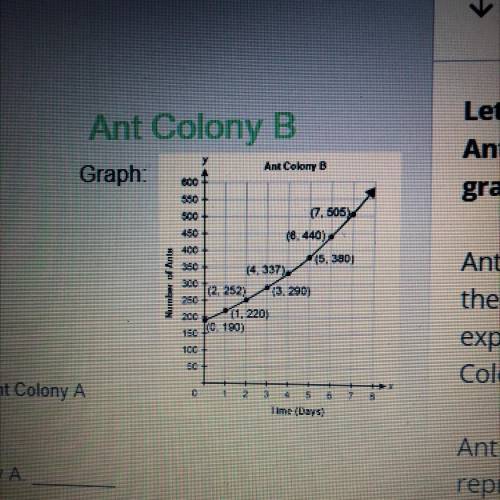
Ant Colony B: There is a graph on the whiteboard that
represents the number of ants in Ant Colony B during
the same time period.

Answers: 2


Other questions on the subject: Mathematics
Mathematics, 21.06.2019 17:00, emmaline11
Acertain population of bacteria demonstrates exponential growth doubles in size every 4 days. how long will it take the population to triple in size?
Answers: 1
Mathematics, 21.06.2019 19:30, Flaka2809
Asurvey of 45 teens found that they spent an average of 25.6 hours per week in front of a screen (television, computer, tablet, phone, based on the survey’s sample mean, which value could be the population mean? 2.3 hours 27.4 hours 75.3 hours 41.5 hours
Answers: 1
Mathematics, 22.06.2019 00:30, bossefamily1
Use the irregular polygon below. show all work. a. find the perimeter. b. find the area. the angles of the irregular polygon is 2, 8, 8, and 4.
Answers: 2
You know the right answer?
Let's compare two ant colonies: Ant Colony A and
Ant Colony B. We will use a function, a table, and...
Questions in other subjects:


Mathematics, 10.11.2019 06:31
Chemistry, 10.11.2019 06:31


