
Mathematics, 09.12.2020 06:40 stodd9503
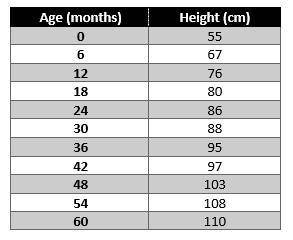
The data below represents the relationship between the age in months and the height in centimeters. What is the trend?
perfect positive correlation
high positive correlation
low positive correlation
no correlation

Answers: 3


Other questions on the subject: Mathematics
Mathematics, 21.06.2019 14:10, joylsbarbour
Will give brainliest series to sigma notation write the following series in sigma notation. 6+10+14+18+22+26+30 example image shown below.
Answers: 1
Mathematics, 21.06.2019 15:10, sunshine52577oyeor9
Which of the following is a proper fraction? a. 9⁄8 b. 5⁄6 c. 7⁄3 d. 4⁄2
Answers: 2
Mathematics, 21.06.2019 23:00, dianereyes7475
The angles in a triangle are represented by 5x, 8x, and 2x+9. what is the value of ? a.10.8 b.11.4 c.9.7 d.7.2
Answers: 2
You know the right answer?
The data below represents the relationship between the age in months and the height in centimeters....
Questions in other subjects:


Chemistry, 31.07.2019 22:30


