
Mathematics, 09.12.2020 06:20 laylay120
The tree Diagram shows all the possible ways three Candidates (A, B,C) could run for
president and 4 candidates (1,2,3,4) Could run for Vice president.
Tell us all the possible outcomes we could have a new President and a new Vice President.
Example, A1,A2...
Closing: Using the simulation you did today in class and the tree diagram for the theoretical
Probability what conclusion can you make about the Theoretical Probability and the
Experimental Probability of an event occuring?
2
3
c
2.
3
Definitions:
Theoretical probability is a method to express the likelihood that something will
occur. It is calculated by dividing the number of favorable outcomes by the total
possible outcomes. The result is a ratio that can be expressed as a fraction (like 2/5).
or a decimal 4, or percent, 40%
Experimental probability is probability that is determined on the basis of the results
of an experiment repeated many times.

Answers: 3


Other questions on the subject: Mathematics
Mathematics, 21.06.2019 14:40, olivialaine31
Which graph represents the following piecewise defined function?
Answers: 2
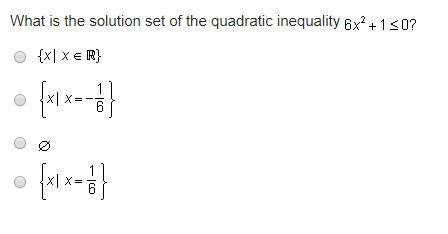
Mathematics, 21.06.2019 18:20, katlynnschmolke
What is the solution set of the quadratic inequality x2- 5< 0? o {xl-55x55{x- 155x55){xl -55x5 15){x1 - 15 sx5/5)
Answers: 2
Mathematics, 21.06.2019 21:30, adamsc819
Design an er diagram for keeping track of information about votes taken in the u. s. house of representatives during the current two-year congressional session. the database needs to keep track of each u. s. state's name (e. g., texas', new york', california') and include the region of the state (whose domain is {northeast', midwest', southeast', southwest', west'}). each congress person in the house of representatives is described by his or her name, plus the district represented, the start date when the congressperson was first elected, and the political party to which he or she belongs (whose domain is {republican', democrat', 'independent', other'}). the database keeps track of each bill (i. e., proposed law), including the bill name, the date of vote on the bill, whether the bill passed or failed (whose domain is {yes', no'}), and the sponsor (the congressperson(s) who sponsored - that is, proposed - the bill). the database also keeps track of how each congressperson voted on each bill (domain of vote attribute is {yes', no', abstain', absent'}). additional information:
Answers: 1
You know the right answer?
The tree Diagram shows all the possible ways three Candidates (A, B,C) could run for
president and...
Questions in other subjects:

Biology, 04.11.2020 20:40

Mathematics, 04.11.2020 20:40

English, 04.11.2020 20:40

Mathematics, 04.11.2020 20:40


