
Mathematics, 08.12.2020 23:50 robert7248
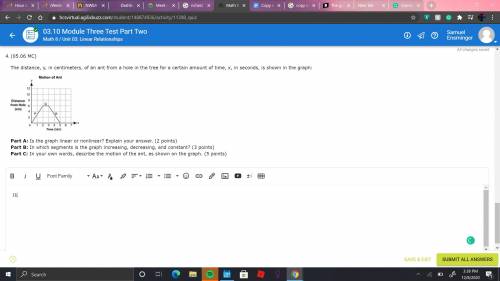
The distance, y, in centimeters, of an ant from a hole in the tree for a certain amount of time, x, in seconds, is shown in the graph:
A graph titled Motion of Ant is shown. The graph shows time in seconds on the x-axis and the Distance from Hole in centimeters on the y-axis. The scale on the x-axis is shown from 0 to 6 at increments of 1, and the scale on the y-axis is shown from 0 to 12 at increments of 2. The graph has 3 straight lines. The first line is labeled P and joins ordered pairs 0, 0 and 2, 6. The second line is labeled Q and joins ordered pairs 2, 6 and 3, 6. The third line is labeled R and joins ordered pairs 3, 6 and 5, 0.
Part A: Is the graph linear or nonlinear? Explain your answer. (2 points)
Part B: In which segments is the graph increasing, decreasing, and constant? (3 points)
Part C: In your own words, describe the motion of the ant, as shown on the graph. (5 points)

Answers: 2


Other questions on the subject: Mathematics
Mathematics, 21.06.2019 19:30, kelseybell2707
If the ratio of sum of the first m and n terms of an ap is m2 : n2 , show that the ratio of its mth and nth terms is (2m − 1) : (2n − 1).
Answers: 1
You know the right answer?
The distance, y, in centimeters, of an ant from a hole in the tree for a certain amount of time, x,...
Questions in other subjects:

Mathematics, 23.06.2021 19:40
Mathematics, 23.06.2021 19:40


Social Studies, 23.06.2021 19:40
Mathematics, 23.06.2021 19:40


