
Mathematics, 08.12.2020 22:30 AlexRavenwood127
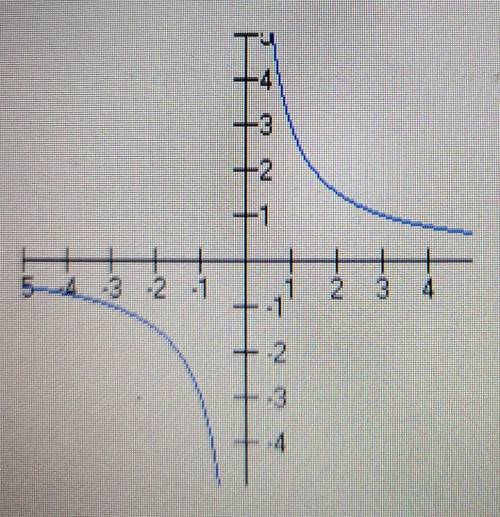
Question 1 of 10 Which of the following best describes the graph below?
A. It is a one-to-one function
B. It is a function but it is not one-to-one. C. It is a many to one function
D. It is not a function

Answers: 2


Other questions on the subject: Mathematics
Mathematics, 21.06.2019 13:10, lg0844
An alien has just landed from the planet, iksnimak. he would like to leam how to add two fractions when thedenominators are the same. write a paragraph that explains to our alien friend, in your own words, the detailsabout how to add the fractions, how to change the result to a mixed number, and how to reduce the fractionpart. use this problem as your example: the two fractions are 5/8 & 7/8
Answers: 1
Mathematics, 21.06.2019 23:50, davfar334p47luq
Given δjkl : δxyz, find x. a)10 b)12 c)16 d)20
Answers: 2
Mathematics, 22.06.2019 01:30, zitterkoph
The box plots show the distributions of the numbers of words per line in an essay printed in two different fonts.which measure of center would be best to compare the data sets? the median is the best measure because both distributions are left-skewed.the mean is the best measure because both distributions are left-skewed.the median is the best measure because both distributions are symmetric.the mean is the best measure because both distributions are symmetric
Answers: 1
You know the right answer?
Question 1 of 10 Which of the following best describes the graph below?
A. It is a one-to-one funct...
Questions in other subjects:

Social Studies, 23.07.2019 17:30


History, 23.07.2019 17:30


