
Mathematics, 08.12.2020 21:50 lovedebrap11ih4
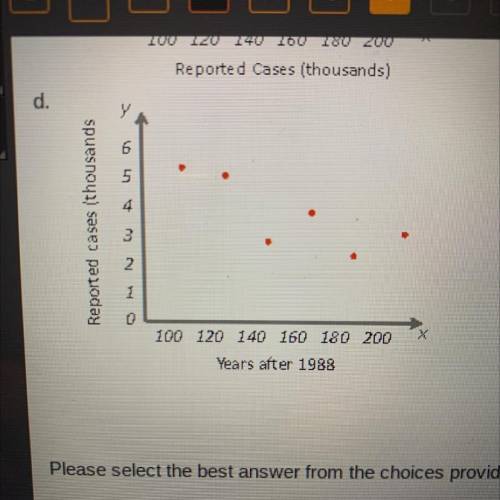
The following table gives the number of chicken pox cases after 1988. The variable x represents the number of years
after 1988. The variable y represents the number of cases in thousands.
Which scatter plot accurately depicts the data in the table

Answers: 2


Other questions on the subject: Mathematics
Mathematics, 21.06.2019 21:30, anaemigarcia
What is the solution to this system of equations? y= 2x - 3.5 x - 2y = -14
Answers: 2
You know the right answer?
The following table gives the number of chicken pox cases after 1988. The variable x represents the...
Questions in other subjects:

Social Studies, 06.11.2020 01:00
Mathematics, 06.11.2020 01:00


