
Mathematics, 08.12.2020 21:40 weeblordd
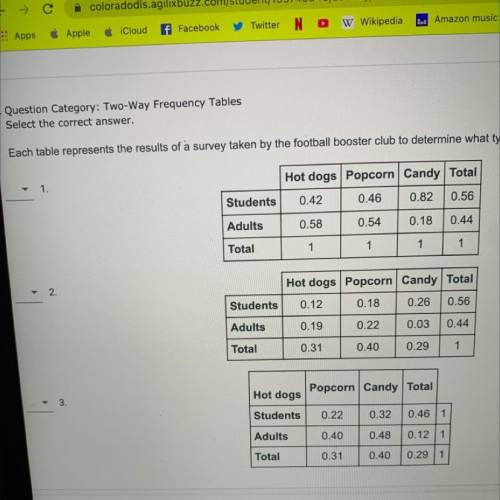
Each table represents the results of a survey taken by the football booster club to determine what types of concessions they should offer at football games. Determine which relative frequency table would be the best choice to find each piece of information.
a.
the percentage of people surveyed who are adults and prefer hot dogs
b.
the percentage of people with a preference for candy who are students
c.
the percentage of students who prefer popcorn

Answers: 2


Other questions on the subject: Mathematics
Mathematics, 21.06.2019 14:10, jessicaflower277
Can't gugys answer the ratio question. this is urgent the plans of a building is drawn toward scale of 1: 1000. kfc the foyer on the plans measures 62mm by 54mm, how large is the foyer in real life?
Answers: 1
Mathematics, 21.06.2019 17:30, ultimateapes
Jacks bank statement shows an account balance of -$25.50. which describes the magnitude, of size, of the debt in dollars
Answers: 2
Mathematics, 21.06.2019 18:30, amorosoavap5cejz
You receive 15% of the profit from a car wash how much money do you receive from a profit of 300
Answers: 2
You know the right answer?
Each table represents the results of a survey taken by the football booster club to determine what t...
Questions in other subjects:

Biology, 10.03.2021 09:50

Mathematics, 10.03.2021 09:50

Mathematics, 10.03.2021 09:50
Mathematics, 10.03.2021 09:50
Mathematics, 10.03.2021 09:50


