
Mathematics, 08.12.2020 21:00 elsauceomotho
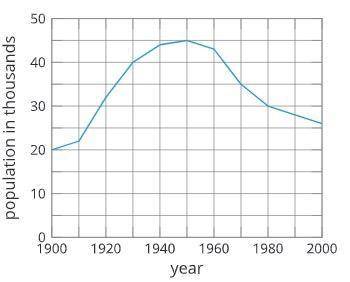
The graph shows the population of a city form 1900 to 2000.
What is the the average rate of change of the population between 1930 and 1950?
Remember the average rate of change formula:
f(b)−f(a)/b-a
Hint: that is the same as slope.
Group of answer choices
A. 200 people per year
B. 250 people per year
C. 300 people per year
D. 400 people per year

Answers: 1


Other questions on the subject: Mathematics
Mathematics, 21.06.2019 23:40, averycipher
Which point-slope form equation represents a line that passes through (3,-2) with a slope of -4/5
Answers: 1
Mathematics, 22.06.2019 01:20, lauretta
Aprobability experiment is conducted in which the sample space of the experiment is s={7,8,9,10,11,12,13,14,15,16,17,18 }, event f={7,8,9,10,11,12}, and event g={11,12,13,14}. assume that each outcome is equally likely. list the outcomes in f or g. find p(f or g) by counting the number of outcomes in f or g. determine p(f or g) using the general addition rule.
Answers: 2
You know the right answer?
The graph shows the population of a city form 1900 to 2000.
What is the the average rate of change...
Questions in other subjects:
Mathematics, 02.02.2021 17:50
Mathematics, 02.02.2021 17:50

Chemistry, 02.02.2021 17:50
Mathematics, 02.02.2021 17:50
Mathematics, 02.02.2021 17:50

English, 02.02.2021 17:50


