
Mathematics, 08.12.2020 20:10 blakesmith0110
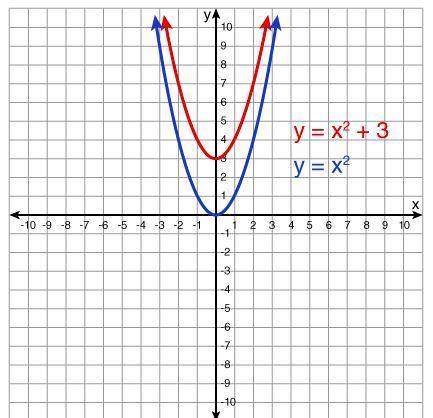
A quadratic function models the graph of a parabola. The quadratic functions, y = x2 and y = x2 + 3, are modeled in the graphs of the parabolas shown below.
Determine which situations best represent the scenario shown in the graph of the quadratic functions, y = x2 and y = x2 + 3. Select all that apply.
From x = -2 to x = 0, the average rate of change for both functions is negative
For the quadratic function, y = x^2, the coordinate (2, 3) is a solution to the equation of the function.
The quadratic function, y = x^2 + 3, has an x-intercept at the origin
The quadratic function, y = x^2, has an x-intercept at the origin
From x = -2 to x = 0, the average rate of change for both functions is positive
For the quadratic function, y = x^2 + 3, the coordinate (2, 7) is a solution to the equation of the function.

Answers: 2


Other questions on the subject: Mathematics
Mathematics, 21.06.2019 17:30, corinaartsy
Match each function with its rate of growth or decay
Answers: 1
Mathematics, 21.06.2019 22:10, mairealexander87
Jayne is studying urban planning and finds that her town is decreasing in population by 3% each year. the population of her town is changing by a constant rate. true or false?
Answers: 1
You know the right answer?
A quadratic function models the graph of a parabola. The quadratic functions, y = x2 and y = x2 + 3,...
Questions in other subjects:

Biology, 09.12.2020 19:20

History, 09.12.2020 19:20

English, 09.12.2020 19:20

Mathematics, 09.12.2020 19:20
English, 09.12.2020 19:20

Health, 09.12.2020 19:20
Mathematics, 09.12.2020 19:20


