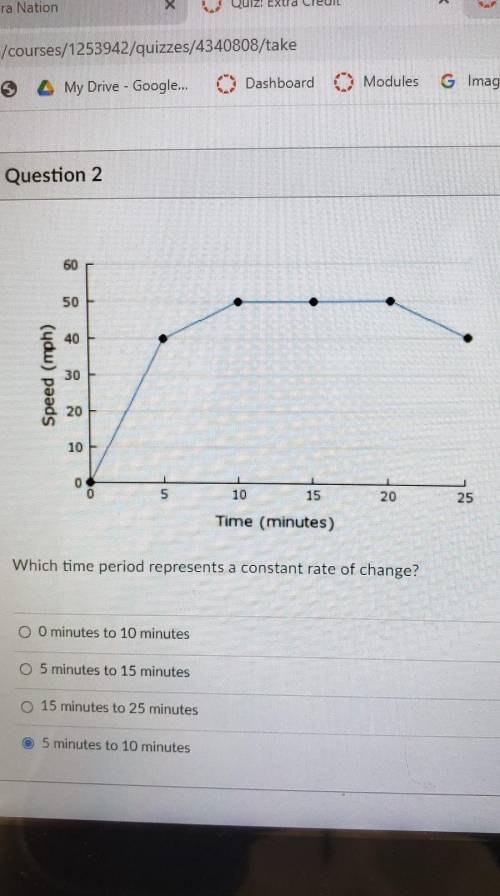
Which time period represents a constant rate of change?
...

Mathematics, 08.12.2020 19:50 marjae188jackson
Which time period represents a constant rate of change?

Answers: 3


Other questions on the subject: Mathematics
Mathematics, 21.06.2019 18:00, nanny2204p4ipj9
Acompany wants to reduce the dimensions of its logo by one fourth to use on business cards. if the area of the original logo is 4 square inches, what is the area of the logo that will be used on the business cards?
Answers: 1
Mathematics, 21.06.2019 21:30, stressedmolly8387
An annual marathon covers a route that has a distance of approximately 26 miles. winning times for this marathon are all over 2 hours. the following data are the minutes over 2 hours for the winning male runners over two periods of 20 years each. earlier period 14 12 15 22 13 10 19 13 9 14 20 18 16 20 23 12 18 17 6 13 recent period 7 11 7 14 8 9 11 14 8 7 9 8 7 9 9 9 9 8 10 8 (a) make a stem-and-leaf display for the minutes over 2 hours of the winning times for the earlier period. use two lines per stem. (use the tens digit as the stem and the ones digit as the leaf. enter none in any unused answer blanks. for more details, view how to split a stem.) minutes beyond 2 hours earlier period 0 1 2 (b) make a stem-and-leaf display for the minutes over 2 hours of the winning times for the recent period. use two lines per stem. (use the tens digit as the stem and the ones digit as the leaf. enter none in any unused answer blanks.) minutes beyond 2 hours recent period (c) compare the two distributions. how many times under 15 minutes are in each distribution
Answers: 2
Mathematics, 22.06.2019 01:30, karsenbeau
Given are five observations for two variables, x and y. xi 1 2 3 4 5 yi 3 7 5 11 14 which of the following is a scatter diagrams accurately represents the data? what does the scatter diagram developed in part (a) indicate about the relationship between the two variables? try to approximate the relationship betwen x and y by drawing a straight line through the data. which of the following is a scatter diagrams accurately represents the data? develop the estimated regression equation by computing the values of b 0 and b 1 using equations (14.6) and (14.7) (to 1 decimal). = + x use the estimated regression equation to predict the value of y when x = 4 (to 1 decimal). =
Answers: 3
You know the right answer?
Questions in other subjects:


Biology, 19.10.2020 22:01
Mathematics, 19.10.2020 22:01

Computers and Technology, 19.10.2020 22:01


