
Mathematics, 08.12.2020 06:00 zitlays
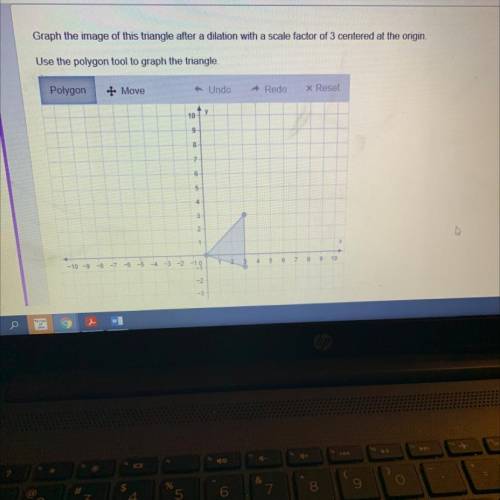
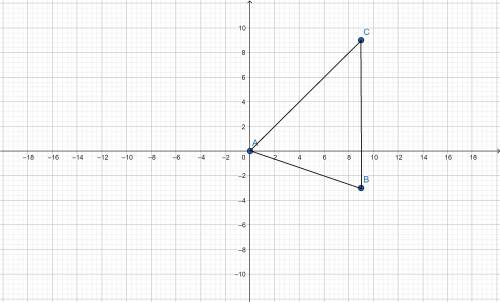
Graph the image of this triangle after a dilation with a scale factor of 3 centered at the origin
Use the polygon tool to graph the triangle.
Polygon
# Move
Undo
Redo
x Reset
y
10
9
8
7
6
5
4
3
2.
1
-10 -9 -8 -7 -6 -5 -4 -3 -2 -10
4
5
6
7
8
9
10
Q
d
w]

Answers: 2


Other questions on the subject: Mathematics
Mathematics, 21.06.2019 23:10, jaylenmiller437
Astudent draws two parabolas on graph paper. both parabolas cross the x-axis at (–4, 0) and (6, 0). the y-intercept of the first parabola is (0, –12). the y-intercept of the second parabola is (0, –24). what is the positive difference between the a values for the two functions that describe the parabolas? write your answer as a decimal rounded to the nearest tenth
Answers: 2
Mathematics, 21.06.2019 23:30, shady1095
Asap (i need to finish this quick) graph complete the sequence of transformations that produces △x'y'z' from △xyz. a clockwise rotation ° about the origin followed by a translation units to the right and 6 units down produces δx'y'z' from δxyz.
Answers: 1
You know the right answer?
Graph the image of this triangle after a dilation with a scale factor of 3 centered at the origin
U...
Questions in other subjects:
Mathematics, 17.06.2021 19:50

Biology, 17.06.2021 19:50

Arts, 17.06.2021 19:50


Computers and Technology, 17.06.2021 19:50
Mathematics, 17.06.2021 19:50

History, 17.06.2021 19:50


