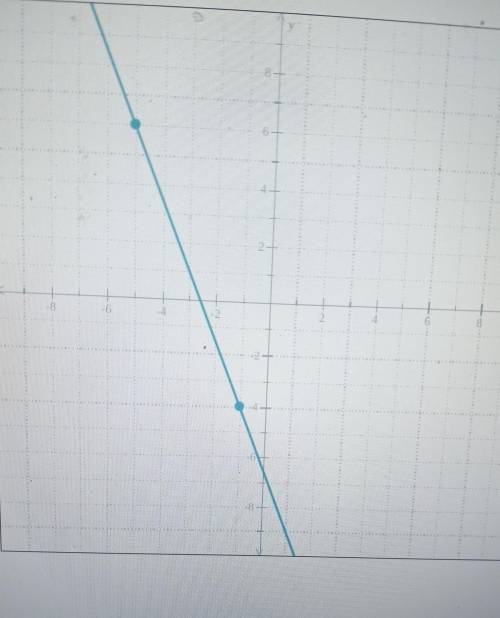
Write an equation for the graph below
...

Mathematics, 08.12.2020 02:50 timithythaxton
Write an equation for the graph below

Answers: 2


Other questions on the subject: Mathematics
Mathematics, 21.06.2019 16:00, jeff7259
The scatter plot graph shows the average annual income for a certain profession based on the number of years of experience which of the following is most likely to be the equation of the trend line for this set of data? a. i=5350e +37100 b. i=5350e-37100 c. i=5350e d. e=5350e+37100
Answers: 1
Mathematics, 21.06.2019 23:40, aydanbelle
Full year - williamshow many square inches are in 60 square feet? 5 square inches72 square inches720 square inche8.640 square inches
Answers: 1
Mathematics, 22.06.2019 04:40, lilycastillo15
Which of the following statements is true? a. sin 18° = cos 72° b. sin 55° = cos 55° с. sin 72° = cos 18° d. bоth a and c.
Answers: 3
You know the right answer?
Questions in other subjects:


