
Mathematics, 08.12.2020 02:30 taylortayshaun7
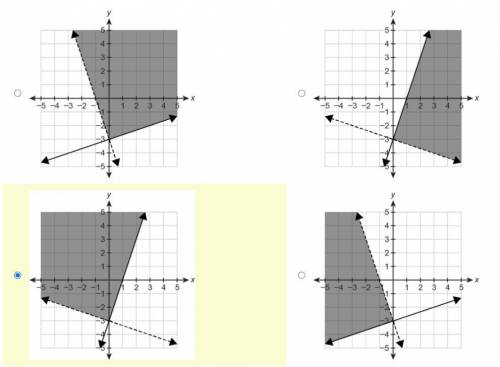
Which graph represents the solution set of the system of inequalities?
{3y≥x−93x+y>−3
please only comment if you dont know, its kinda annoying how much people just use an actaul answer slot to put the fact they dont know, it will be reported
A system of 2 linear inequalities graphed on a coordinate plane. The horizontal x axis ranges from negative 5 to 5 in increments of 1. The vertical y axis ranges from negative 5 to 5 in increments of 1. A dashed line passes through begin ordered pair 0 comma negative 3 end ordered pair and begin ordered pair negative 2 comma 3 end ordered pair. A solid line passes through begin ordered pair 0 comma negative 3 end ordered pair and begin ordered pair negative 3 comma negative 4 end ordered pair. The region above the dashed line and above the solid line is shaded.
A system of 2 linear inequalities graphed on a coordinate plane. The horizontal x axis ranges from negative 5 to 5 in increments of 1. The vertical y axis ranges from negative 5 to 5 in increments of 1. A dashed line passes through begin ordered pair 0 comma negative 3 end ordered pair and begin ordered pair negative 3 comma negative 2 end ordered pair. A solid line passes through begin ordered pair 0 comma negative 3 end ordered pair and begin ordered pair 2 comma 3 end ordered pair. The region above the dashed line and below the solid line is shaded.
A system of 2 linear inequalities graphed on a coordinate plane. The horizontal x axis ranges from negative 5 to 5 in increments of 1. The vertical y axis ranges from negative 5 to 5 in increments of 1. A dashed line passes through begin ordered pair 0 comma negative 3 end ordered pair and begin ordered pair 3 comma negative 4 end ordered pair. A solid line passes through begin ordered pair 0 comma negative 3 end ordered pair and begin ordered pair 2 comma 3 end ordered pair. The region above the dashed line and above the solid line is shaded.
A system of 2 linear inequalities graphed on a coordinate plane. The horizontal x axis ranges from negative 5 to 5 in increments of 1. The vertical y axis ranges from negative 5 to 5 in increments of 1. A dashed line passes through begin ordered pair 0 comma negative 3 end ordered pair and begin ordered pair negative 2 comma 3 end ordered pair. A solid line passes through begin ordered pair 0 comma negative 3 end ordered pair and begin ordered pair 3 comma negative 2 end ordered pair. The region below the dashed line and above the solid line is shaded.

Answers: 3


Other questions on the subject: Mathematics
Mathematics, 21.06.2019 18:30, waldruphope3956
Can someone check if i did this right since i really want to make sure it’s correct. if you do you so much
Answers: 2
You know the right answer?
Which graph represents the solution set of the system of inequalities?
{3y≥x−93x+y>−3
Questions in other subjects:

Mathematics, 06.11.2020 17:40


Mathematics, 06.11.2020 17:40
Mathematics, 06.11.2020 17:40

History, 06.11.2020 17:40
Mathematics, 06.11.2020 17:40


