Select the correct answer.
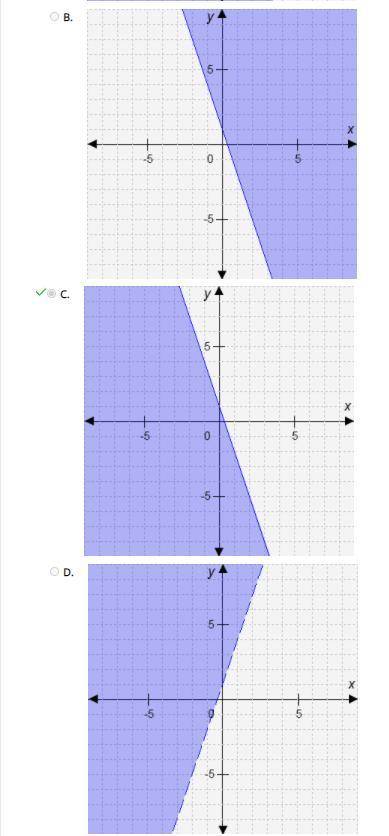
Which graph represents this inequality?
3x + y ≤ 1
(Th...

Mathematics, 08.12.2020 01:10 chjam265
Select the correct answer.
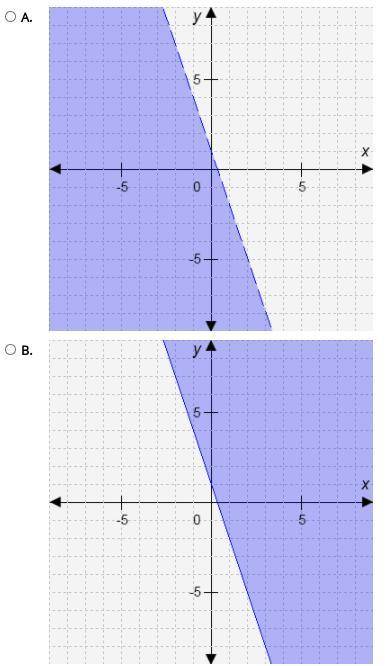
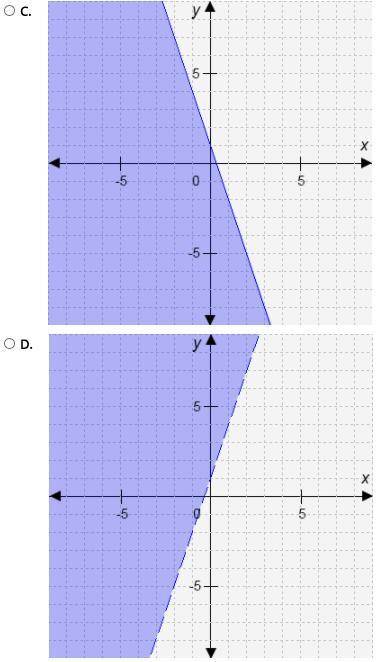
Which graph represents this inequality?
3x + y ≤ 1
(There are two images that contain the options) :)

Answers: 3


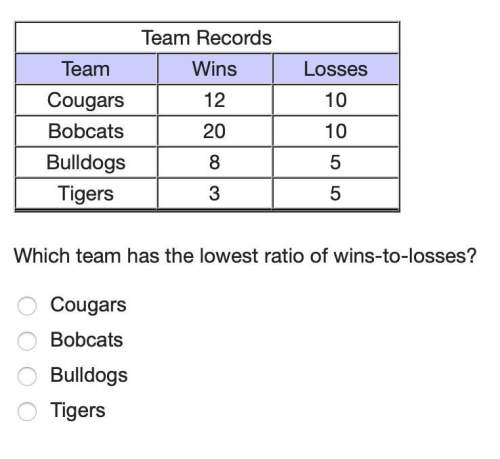
Other questions on the subject: Mathematics
Mathematics, 21.06.2019 18:00, BeautyxQueen
John read the first 114 pages of a novel, which was 3 pages less than 1/3 of the novel. write an equation to determine the total number of pages (p)(p) in the novel.
Answers: 1
Mathematics, 21.06.2019 18:10, chyyy3
The means and mean absolute deviations of the individual times of members on two 4x400-meter relay track teams are shown in the table below. means and mean absolute deviations of individual times of members of 4x400-meter relay track teams team a team b mean 59.32 s 59.1 s mean absolute deviation 1.5 s 245 what percent of team b's mean absolute deviation is the difference in the means? 9% 15% 25% 65%
Answers: 2
Mathematics, 21.06.2019 18:30, allenlog000
Can someone me out here and the tell me the greatest common factor
Answers: 1
You know the right answer?
Questions in other subjects:

Business, 24.12.2021 15:50

Physics, 24.12.2021 15:50
Mathematics, 24.12.2021 15:50
Mathematics, 24.12.2021 15:50


English, 24.12.2021 15:50
Chemistry, 24.12.2021 15:50
Business, 24.12.2021 16:00
English, 24.12.2021 16:00


