
Mathematics, 07.12.2020 19:40 jayleengrant
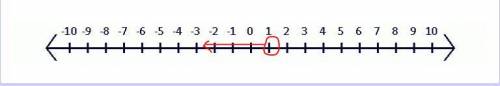
Which graph shows the solution set of the inequality 2.9 (x + 8) less-than 26.1
A number line goes from negative 10 to positive 10. A solid circle appears at 0. The number line is shaded from 0 toward positive 10.
A number line goes from negative 10 to positive 10. An open circle appears at 0. The number line is shaded from 0 toward positive 10.
A number line goes from negative 10 to positive 10. A closed circle appears at positive 1. The number line is shaded from positive 1 toward negative 10.
A number line goes from negative 10 to positive 10. An open circle appears at positive 1. The number line is shaded from positive 1 toward negative 10.

Answers: 1


Other questions on the subject: Mathematics
Mathematics, 21.06.2019 16:50, tahmidtaj150
What is the perimeter of square abcd? units units 28 units 37 units
Answers: 2
Mathematics, 21.06.2019 17:40, ayoismeisalex
Which number produces a rationale number when multiplied by 1/5
Answers: 1
Mathematics, 21.06.2019 18:30, joaquin42
Which of the statements about the graph of the function y = 2x are true? check all of the boxes that apply. the domain is all real numbers x because the exponent of 2 can be any real number when the x-values increases by 1 unit, the y-value multiplies by 2. the y-intercept is (0, 1). the graph never goes below the x-axis because powers of 2 are never negative. the range is all real numbers.
Answers: 1
Mathematics, 21.06.2019 21:00, ambermcneil3839
Aquadrilateral has exactly one pair of parallel sides. which name best describes the figure?
Answers: 3
You know the right answer?
Which graph shows the solution set of the inequality 2.9 (x + 8) less-than 26.1
A number line goes...
Questions in other subjects:
Mathematics, 30.07.2021 05:20

Biology, 30.07.2021 05:20
Mathematics, 30.07.2021 05:20
Biology, 30.07.2021 05:20


