
Mathematics, 07.12.2020 17:00 861819
Please help!
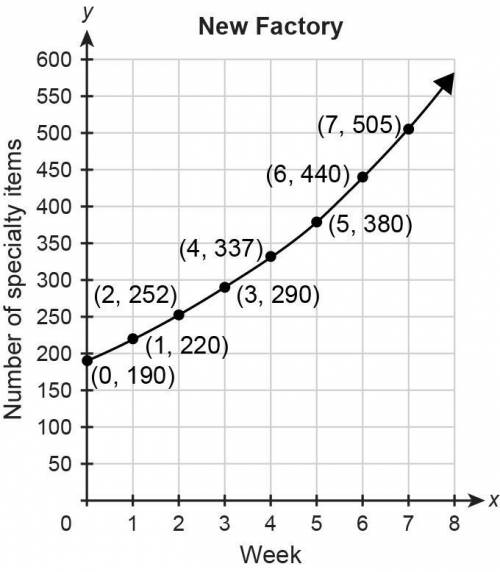
The function p(w) = 230(1)1^w) represents the number of specialty items produced at the old factory w weeks after a change in management. The graph represents the number of specialty items produced at the new factory during the same time period.
(Look at graph below)
(a) During Week 0, how many more specialty items were produced at the old factory than at the new factory? Explain.
(b) Find and compare the growth rates in the weekly number of specialty items produced at each factory. Show your work.
(c) When does the weekly number of specialty items produced at the new factory exceed the weekly number of specialty items produced at the old factory? Explain.

Answers: 2


Other questions on the subject: Mathematics
Mathematics, 21.06.2019 16:00, blackwhiteroses383
Which graph represents the solution set for the given system of inequalities? x+2y< 3 x+y> 4 3x-2y> 4
Answers: 2
Mathematics, 21.06.2019 18:00, aaronhid3
Oscar and julie ashton are celebrating their 15th anniversary by having a reception hall. they have budgeted $4,500 for their reception. if the reception hall charges a $90 cleanup fee plus & 36 per person, find the greatest number of people that they may invite and still stay within their budget.
Answers: 1
Mathematics, 21.06.2019 20:00, smariedegray
Aubrey read 29 books and eli read 52 books what number is equal to the number of books aubrey read?
Answers: 1
Mathematics, 21.06.2019 21:30, kingdrew27
Due to a packaging error, 4 cans labeled diet soda were accidentally filled with regular soda and placed in a 12 pack carton of diet soda. two cans were randomly selected from this 12 pack. what is the probability that both cans were regular soda?
Answers: 2
You know the right answer?
Please help!
The function p(w) = 230(1)1^w) represents the number of specialty items produced at th...
Questions in other subjects:

Mathematics, 17.12.2020 21:20
Mathematics, 17.12.2020 21:20

SAT, 17.12.2020 21:20

History, 17.12.2020 21:20


