
Mathematics, 07.12.2020 05:40 dorindaramirez0531
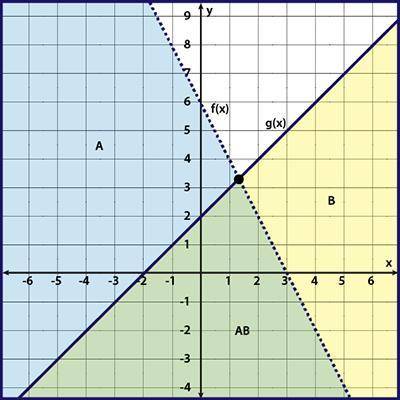
In the graph, the area below f(x) is shaded and labeled A, the area below g(x) is shaded and labeled B, and the area where f(x) and g(x) have shading in common is labeled AB.
The graph represents which system of inequalities?
y < −2x + 6
y ≤ x + 2
y ≤ −2x + 6
y < x + 2
y < 2 over 3x − 2
y ≥ 2x + 2
None of the above

Answers: 1


Other questions on the subject: Mathematics
Mathematics, 21.06.2019 15:30, jaasminfloress
Complete the statements about the system of linear equation respresented by the tables the equation respented the left table is
Answers: 2
Mathematics, 21.06.2019 17:00, raymondmunoz4451
Ifurniture stores having a weekend sale and is offering 20% discount on patio chairs and table the sales tax on furniture is 6.25 using function composition how can you represent the total amount a that you would need to pay for this furniture that cost x dollars
Answers: 1
Mathematics, 21.06.2019 17:30, davidgarcia522083
Which expression can be used to determine the slope of the line that passes through the points -6, three and one, -9
Answers: 3
Mathematics, 21.06.2019 19:30, tiwaribianca475
Cor d? ? me ? max recorded the heights of 500 male humans. he found that the heights were normally distributed around a mean of 177 centimeters. which statements about max’s data must be true? a) the median of max’s data is 250 b) more than half of the data points max recorded were 177 centimeters. c) a data point chosen at random is as likely to be above the mean as it is to be below the mean. d) every height within three standard deviations of the mean is equally likely to be chosen if a data point is selected at random.
Answers: 1
You know the right answer?
In the graph, the area below f(x) is shaded and labeled A, the area below g(x) is shaded and labeled...
Questions in other subjects:
Mathematics, 28.07.2019 02:40
Mathematics, 28.07.2019 02:40


History, 28.07.2019 02:40


