
Mathematics, 06.12.2020 23:10 ikepayton
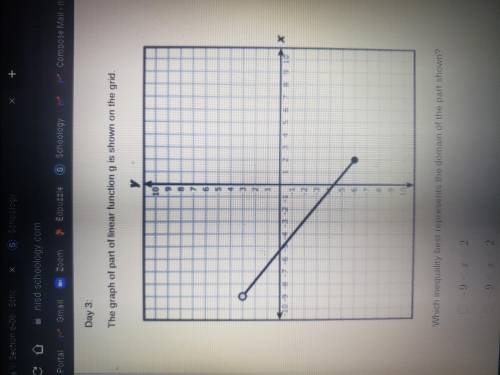
Which grade of part of linear functioning g is shown on the grid. Which inequality best represents the domains of the part shown?

Answers: 2


Other questions on the subject: Mathematics
Mathematics, 20.06.2019 18:04, stackpoolekrysp71si4
Can i get some on 18,20,& 22? or one of them
Answers: 1
Mathematics, 21.06.2019 20:20, bbyjoker
Recall that the owner of a local health food store recently started a new ad campaign to attract more business and wants to know if average daily sales have increased. historically average daily sales were approximately $2,700. the upper bound of the 95% range of likely sample means for this one-sided test is approximately $2,843.44. if the owner took a random sample of forty-five days and found that daily average sales were now $2,984, what can she conclude at the 95% confidence level?
Answers: 1
Mathematics, 21.06.2019 21:40, calebhoover03
Question 1 of 10 2 points different groups of 50 graduates of an engineering school were asked the starting annual salary for their first engineering job after graduation, and the sampling variability was low. if the average salary of one of the groups was $65,000, which of these is least likely to be the average salary of another of the groups? o a. $64,000 o b. $65,000 o c. $67,000 o d. $54,000
Answers: 2
You know the right answer?
Which grade of part of linear functioning g is shown on the grid.
Which inequality best represents...
Questions in other subjects:


Chemistry, 19.01.2021 20:40
Mathematics, 19.01.2021 20:40
Mathematics, 19.01.2021 20:40
Mathematics, 19.01.2021 20:40
Mathematics, 19.01.2021 20:40


