
Mathematics, 04.12.2020 20:00 foreverisabel
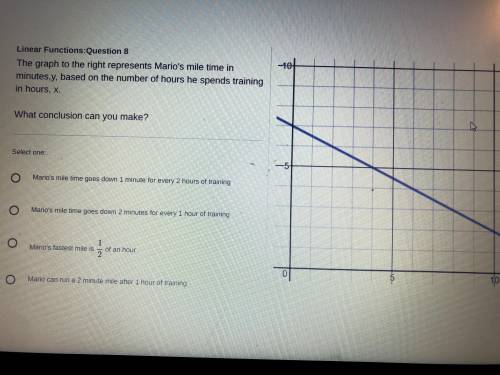
the graph to the right represents mario’s mile time in minutes, y, based on the number of hours he spends training in hours , x what conclusion can you make

Answers: 2


Other questions on the subject: Mathematics
Mathematics, 21.06.2019 14:00, noahwhitfield5331
Suppose a man is heterozygous for heterochromia, an autosomal dominant disorder which causes two different‑colored eyes in an individual, produced 25‑offspring with his normal‑eyed wife. of their children, 15 were heterochromatic and 10 were‑normal. calculate the chi‑square value for this observation.
Answers: 1
Mathematics, 21.06.2019 17:00, MustafaEtroshi
Find dy/dx using implicit differentiation ln(20+e^xy)=y
Answers: 3
Mathematics, 21.06.2019 20:20, bbyjoker
Recall that the owner of a local health food store recently started a new ad campaign to attract more business and wants to know if average daily sales have increased. historically average daily sales were approximately $2,700. the upper bound of the 95% range of likely sample means for this one-sided test is approximately $2,843.44. if the owner took a random sample of forty-five days and found that daily average sales were now $2,984, what can she conclude at the 95% confidence level?
Answers: 1
You know the right answer?
the graph to the right represents mario’s mile time in minutes, y, based on the number of hours he s...
Questions in other subjects:


History, 15.01.2020 22:31


