
Mathematics, 04.12.2020 14:00 lillielupfer6955
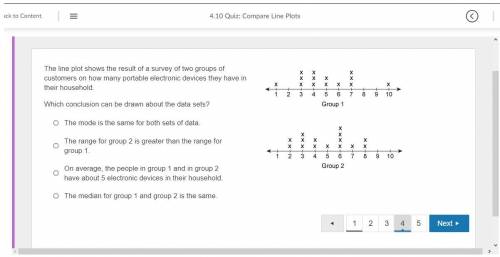
The line plot shows the result of a survey of two groups of customers on how many portable electronic devices they have in their household.
Which conclusion can be drawn about the data sets?
The mode is the same for both sets of data.
The range for group 2 is greater than the range for group 1.
On average, the people in group 1 and in group 2 have about 5 electronic devices in their household.
The median for group 1 and group 2 is the same.

Answers: 3


Other questions on the subject: Mathematics
Mathematics, 21.06.2019 17:00, jesicaagan
Find the value of the variable and the length of each secant segment.
Answers: 1
Mathematics, 21.06.2019 22:30, sonaihriley
Abucket of paint has spilled on a tile floor. the paint flow can be expressed with the function p(t) = 6(t), where t represents time in minutes and p represents how far the paint is spreading. the flowing paint is creating a circular pattern on the tile. the area of the pattern can be expressed as a(p) = 3.14(p)^2 part a: find the area of the circle of spilled paint as a function of time, or a[p(t)]. show your work. part b: how large is the area of spilled paint after 8 minutes? you may use 3.14 to approximate pi in this problem.
Answers: 2
Mathematics, 22.06.2019 00:10, arianna23717
Which of these would have been most likely to have been a carpetbagger during the reconstruction era? a) a new york businessman who relocated to mississippi b) a former slave who was able to buy land in birmingham c) a carolina-born politician who supported the democratic d) a former confederate officer who owned a farm in memphis eliminate
Answers: 1
Mathematics, 22.06.2019 01:40, twinchristiansp4xhd2
Which of the following is the major negative aspect of crossover designs for research studies? a. prohibitive cost b. residual effects c-subject drepout d. incomplete randomization e. large sample size required
Answers: 1
You know the right answer?
The line plot shows the result of a survey of two groups of customers on how many portable electroni...
Questions in other subjects:


Mathematics, 05.11.2020 17:00


Social Studies, 05.11.2020 17:00

History, 05.11.2020 17:00


